The Flights to Rome Website
is the companion to the data viz project↗, but has interesting elements on its own.
- Project LeadBenedikt Groß↗
- Design & VisualizationsMe
- WritingRaphael Reimann↗
- Rendering (Key Visual)Herwig Scherabon↗
- Web developmentThibault Durand↗
Aerial corridors
To tackle this project we used quick visualizations (like an illustrator uses sketches). Often they were interesting in their own right.
For example different flight routes between two airports:
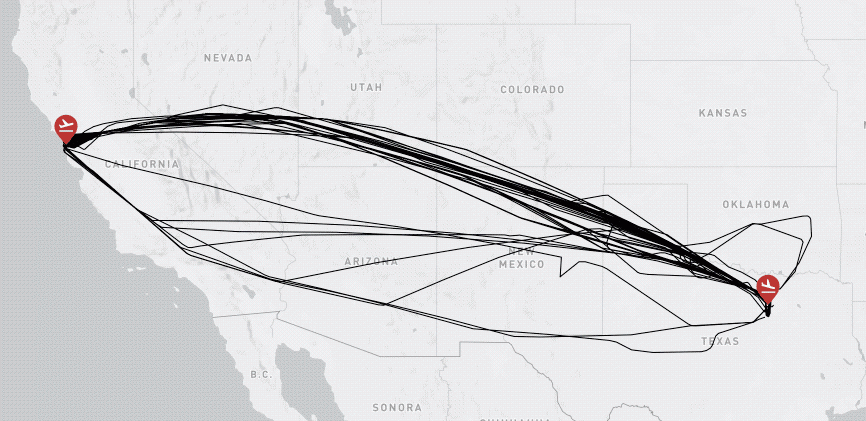
We later learned about aeronautical charts↗ which are used to plan flights.
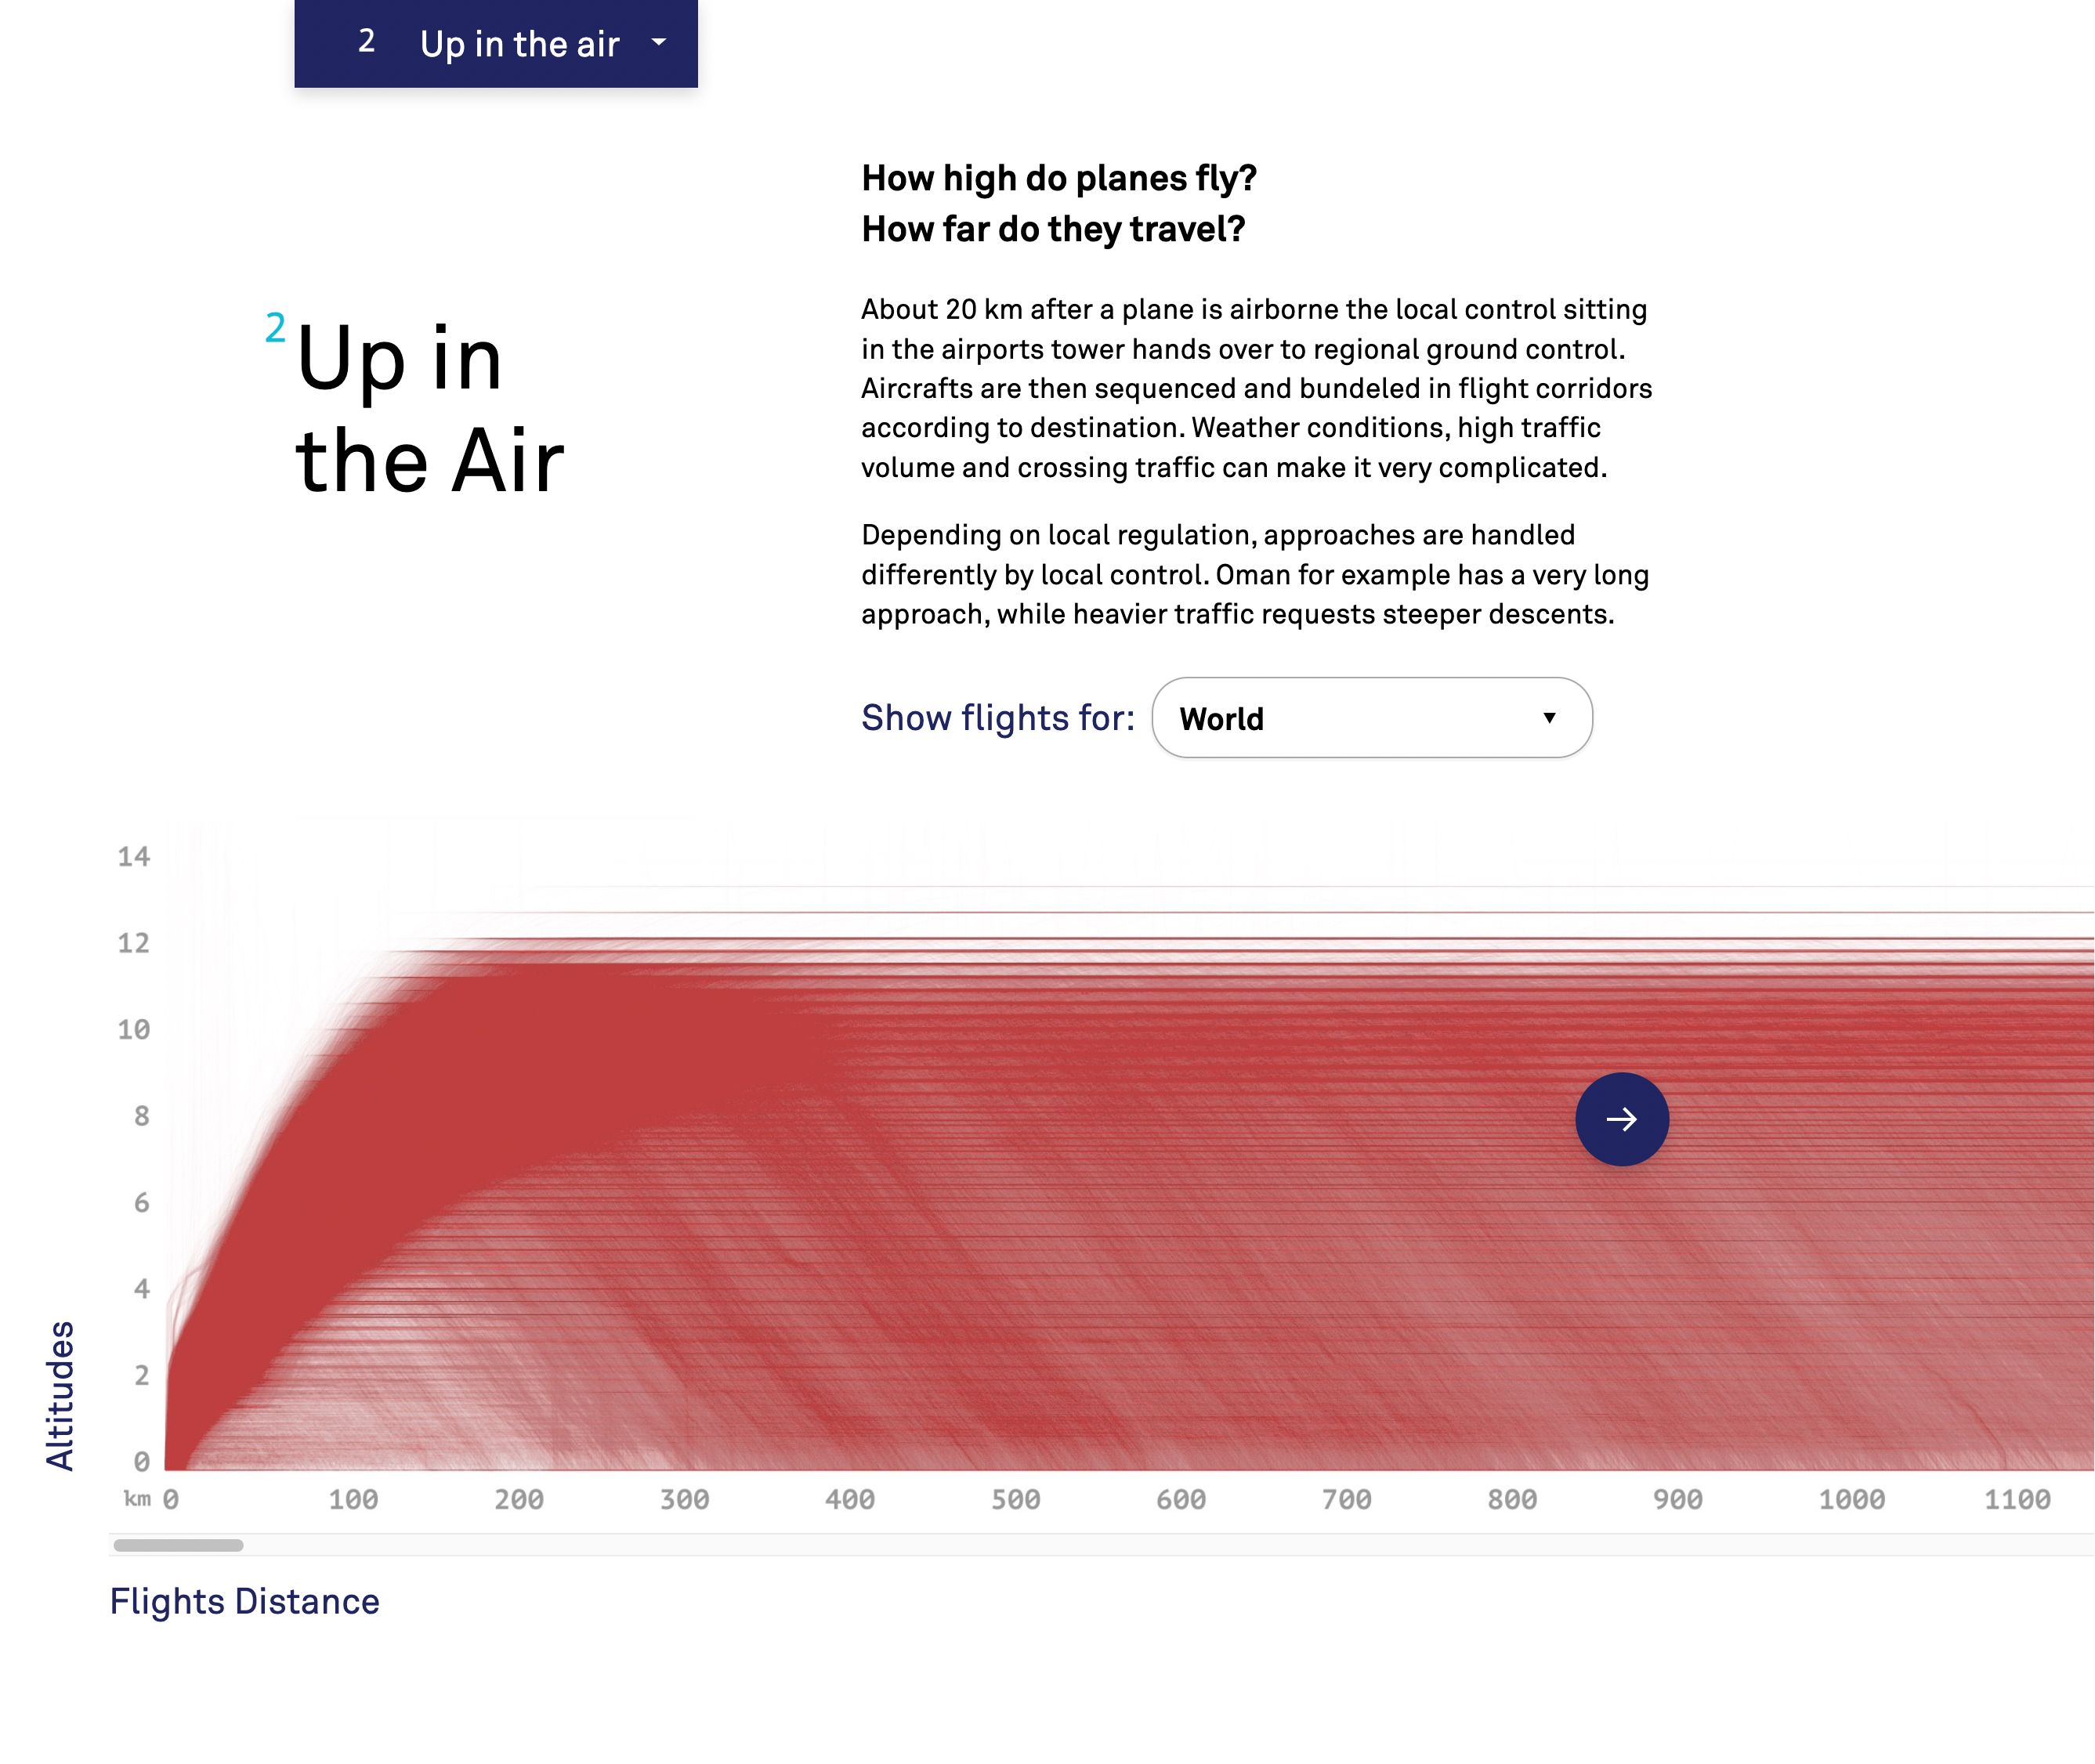
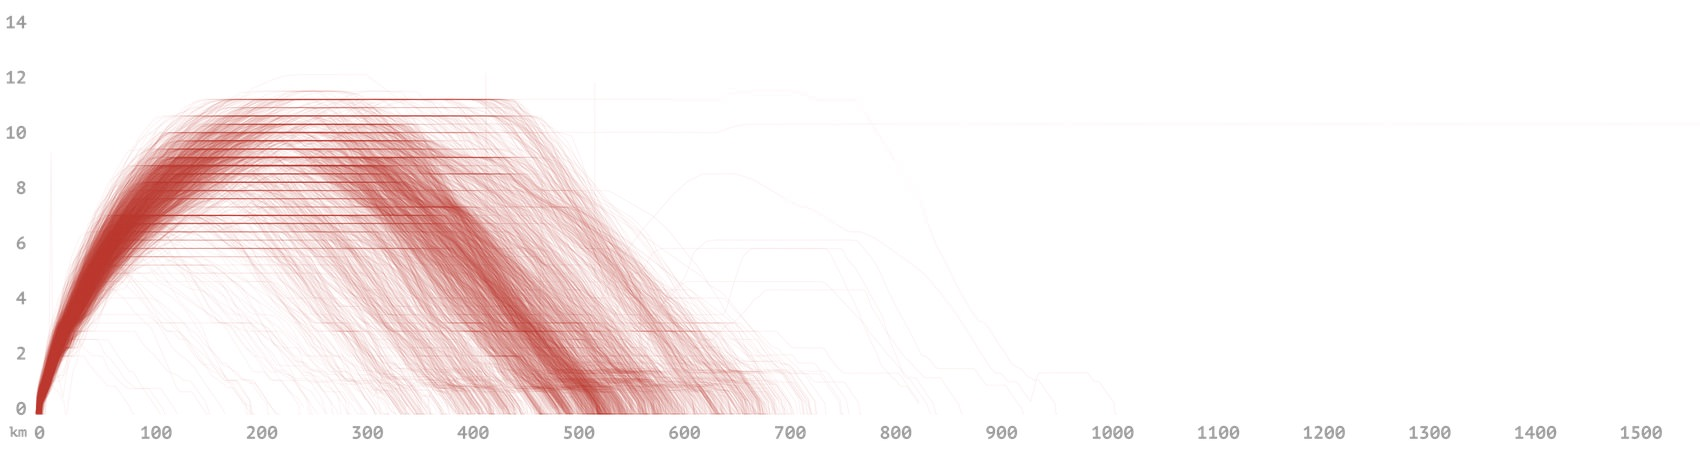
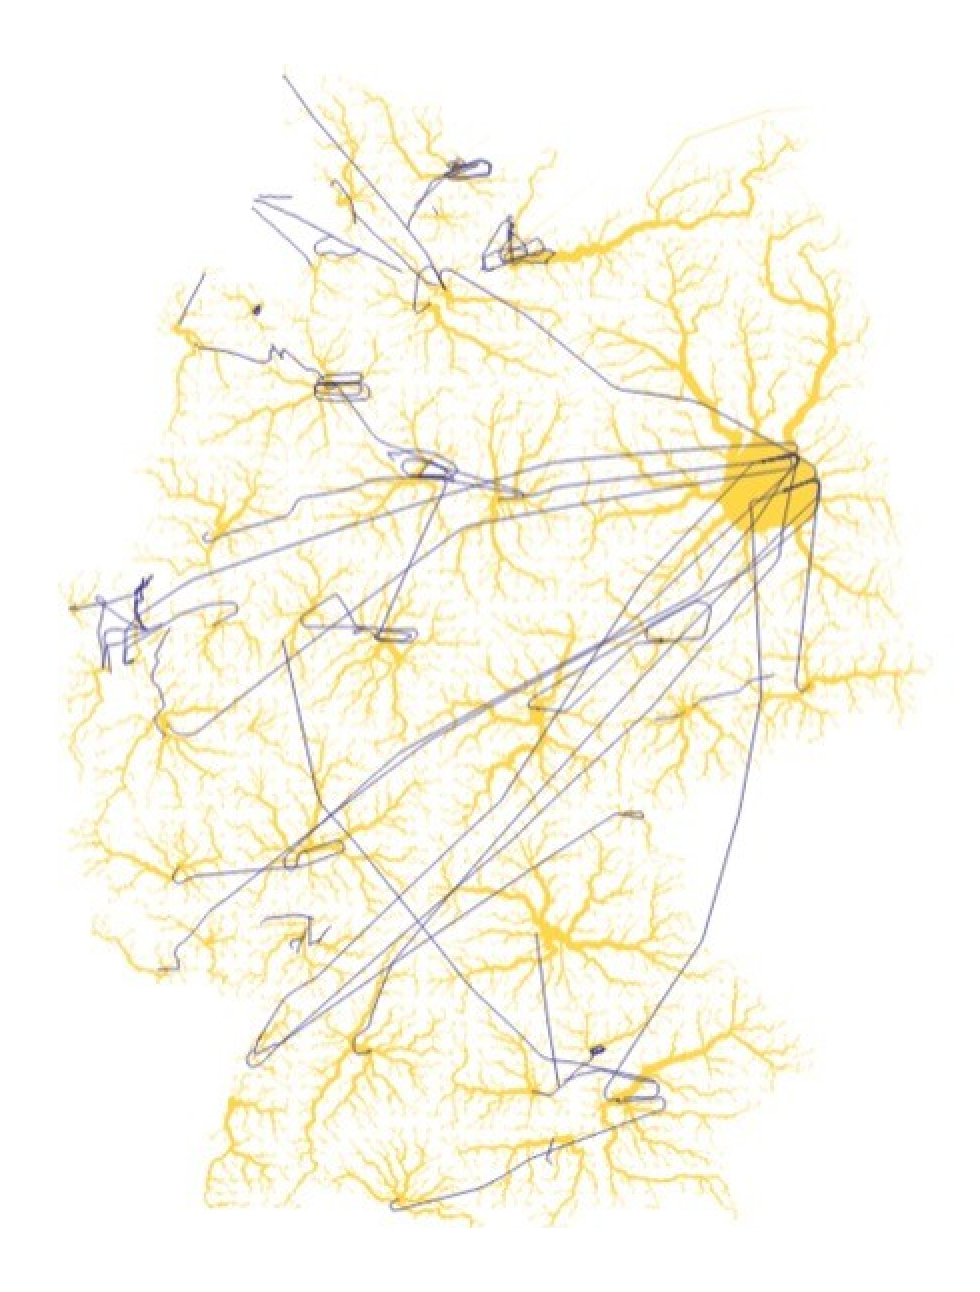
Altitude visualizations
The dataset including altitude so we mapped altitude (y-axis) and distance travelled (x-axis) – globally and domestically.
Germany
USA
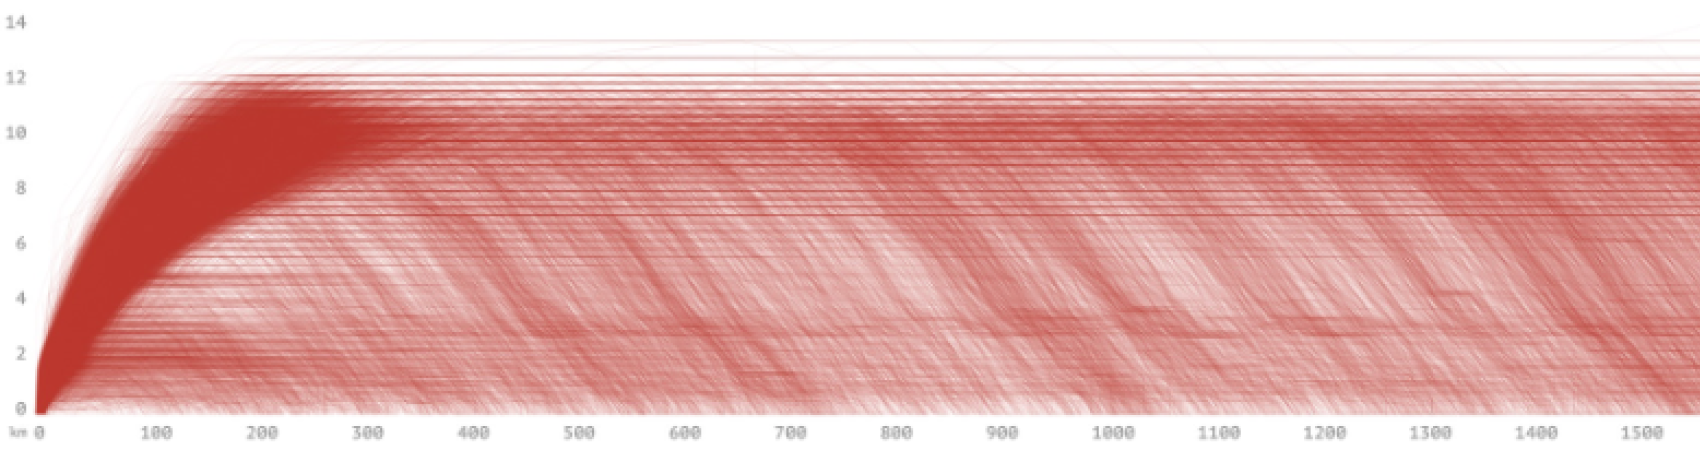
What I personally like: You can see the different altitude levels pilots have to follow (look like horizontal stripes).
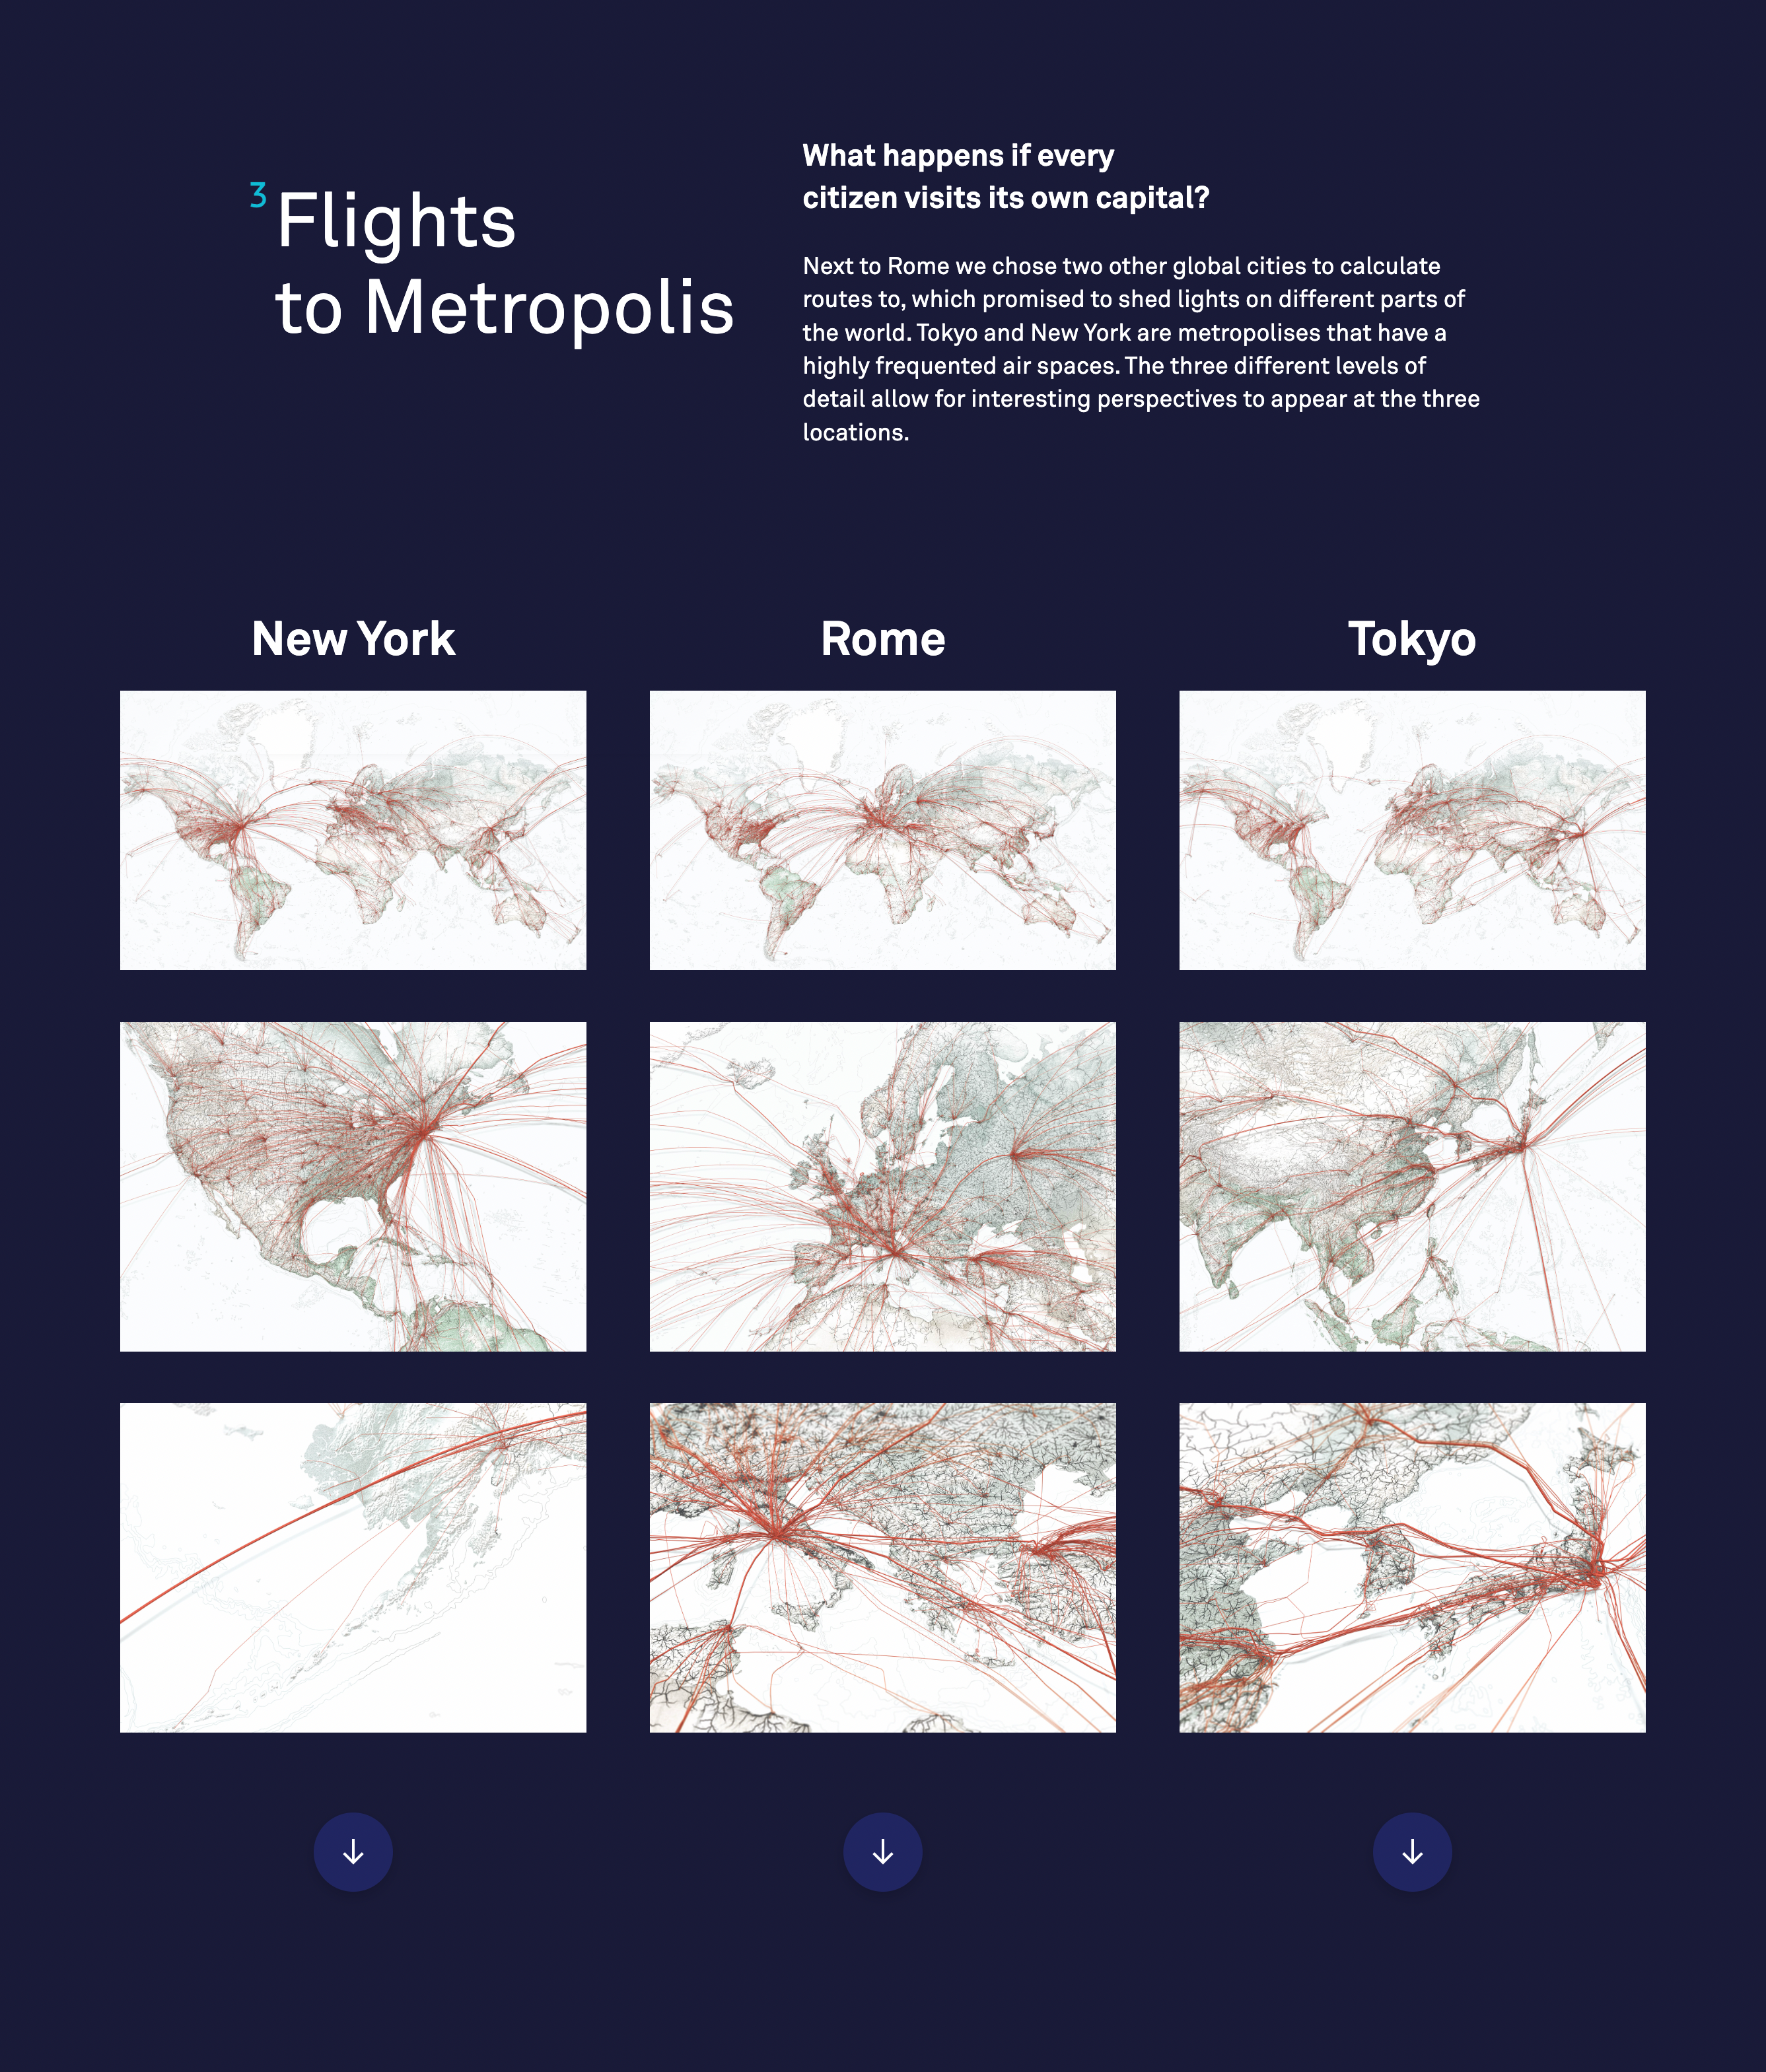
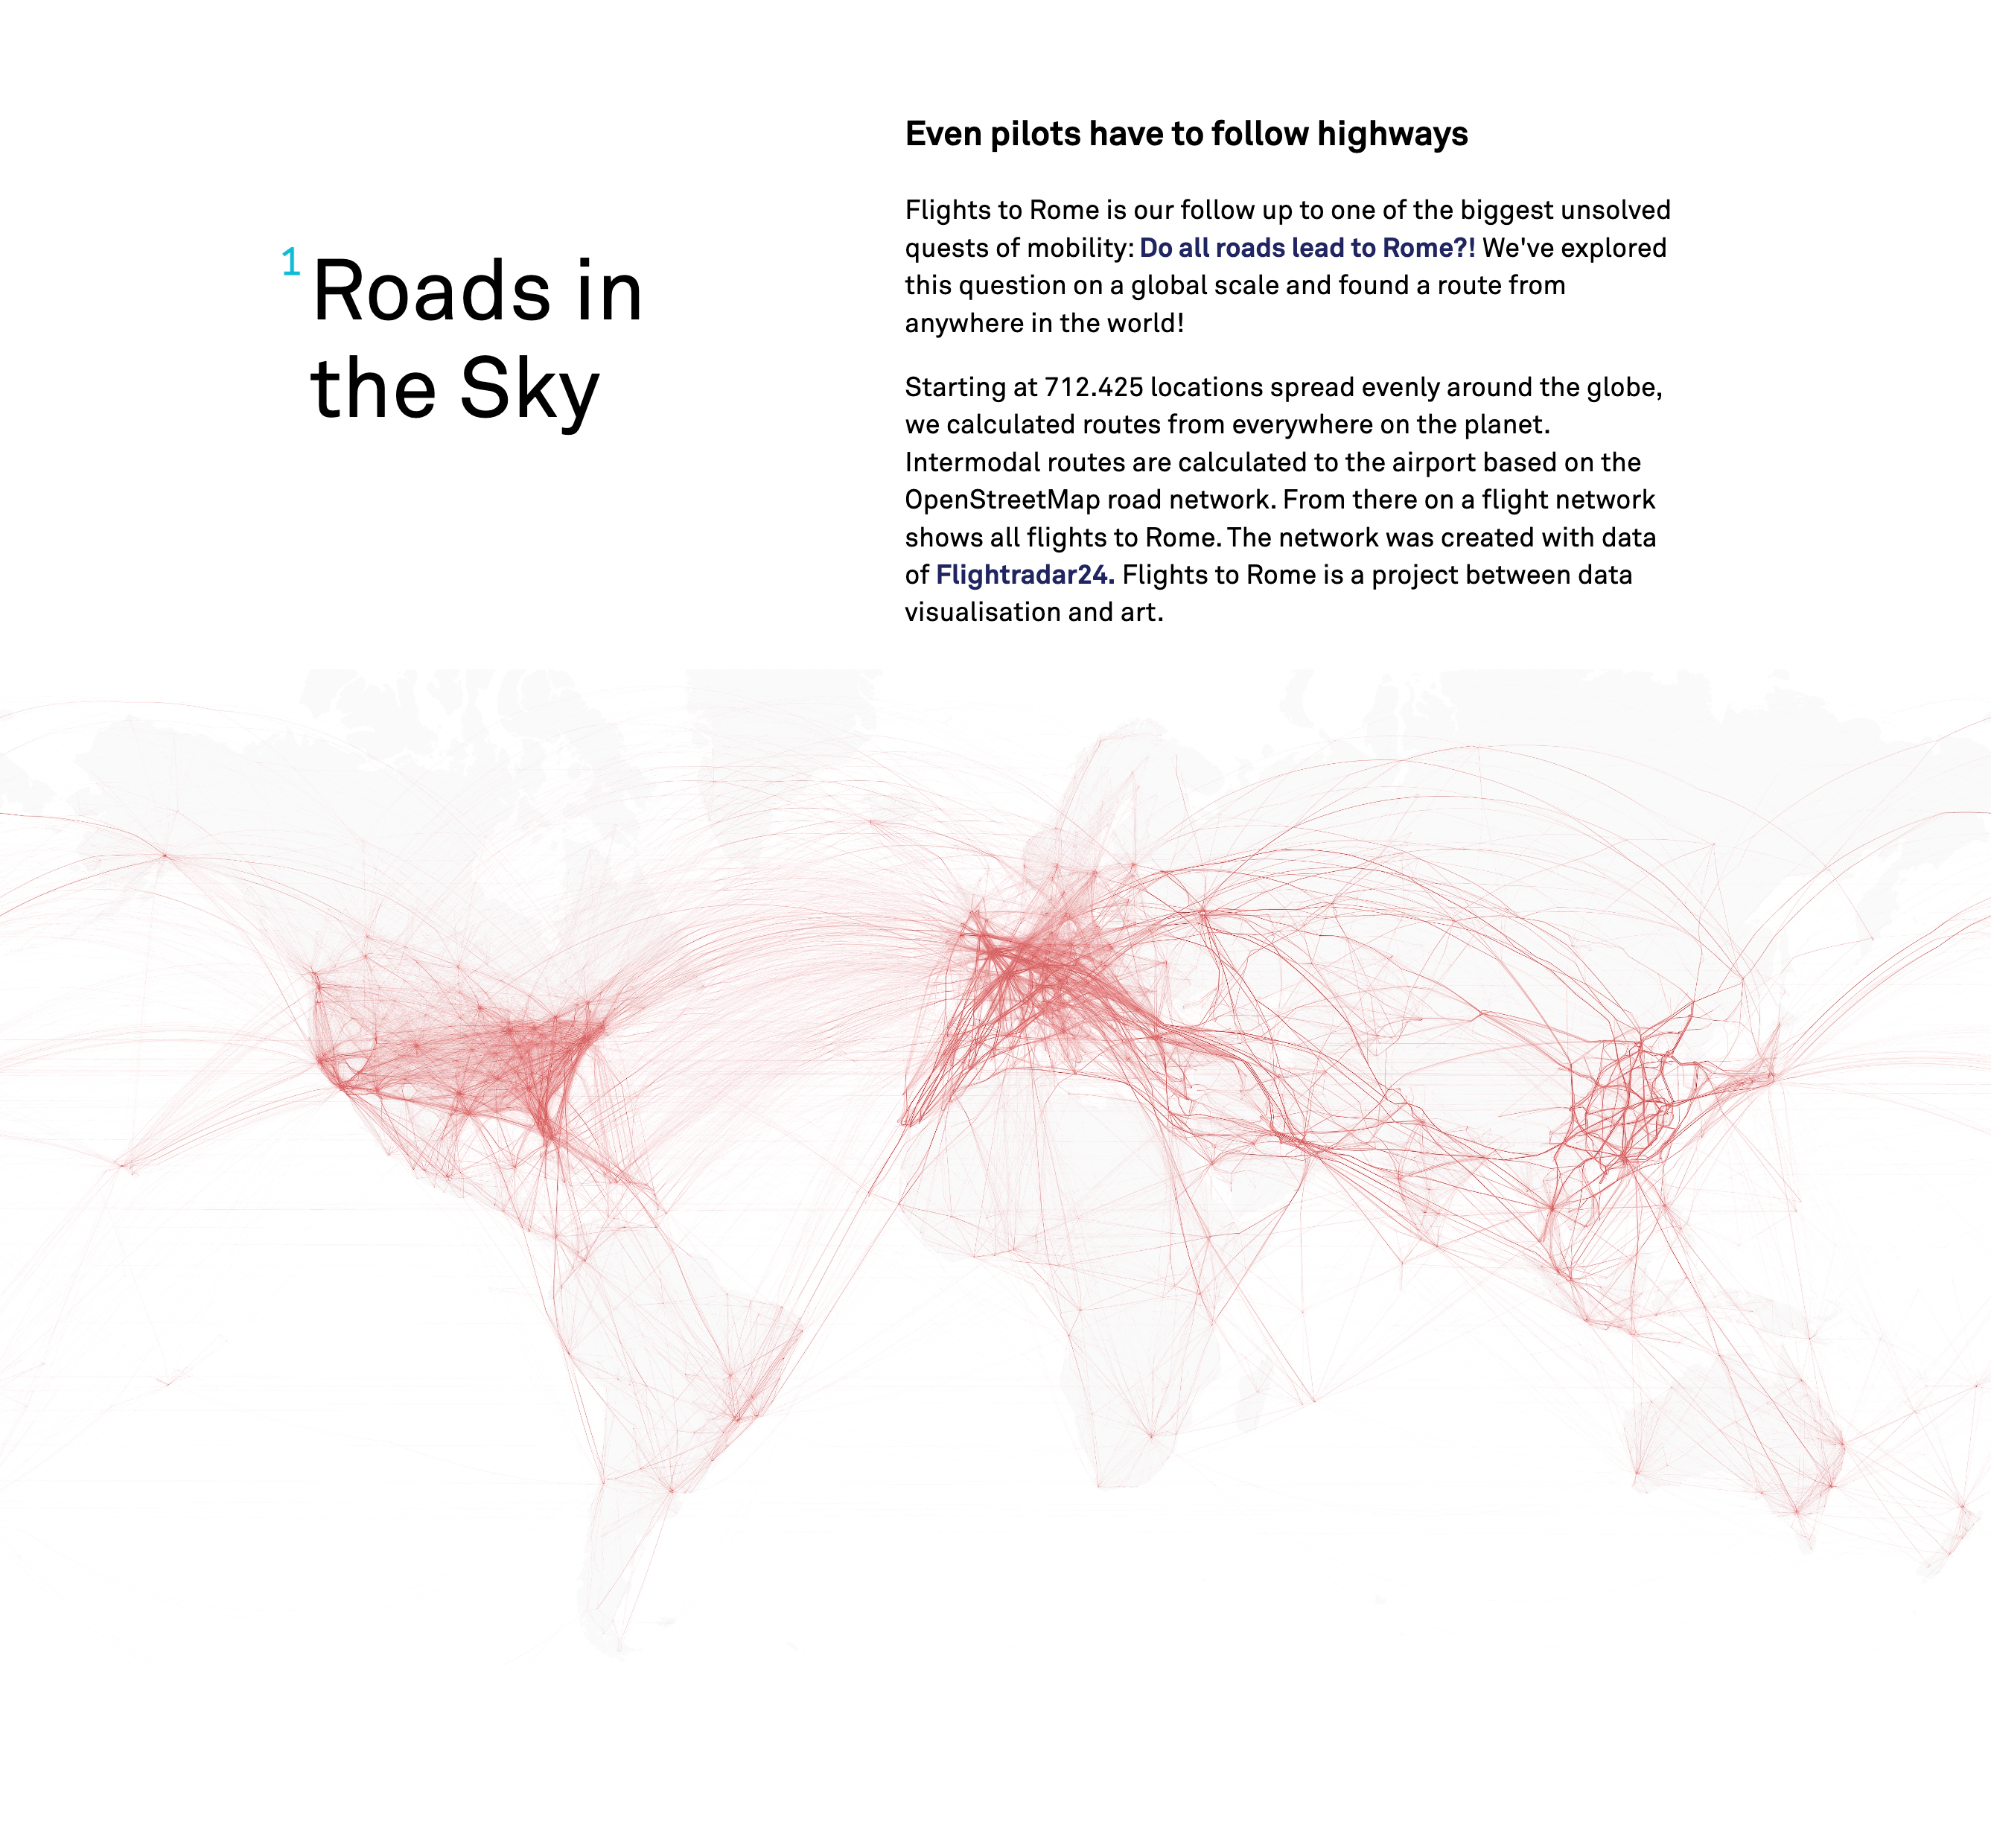
Outcome overview
This section gives and overview of all images we generated, before we show all of them in detail.
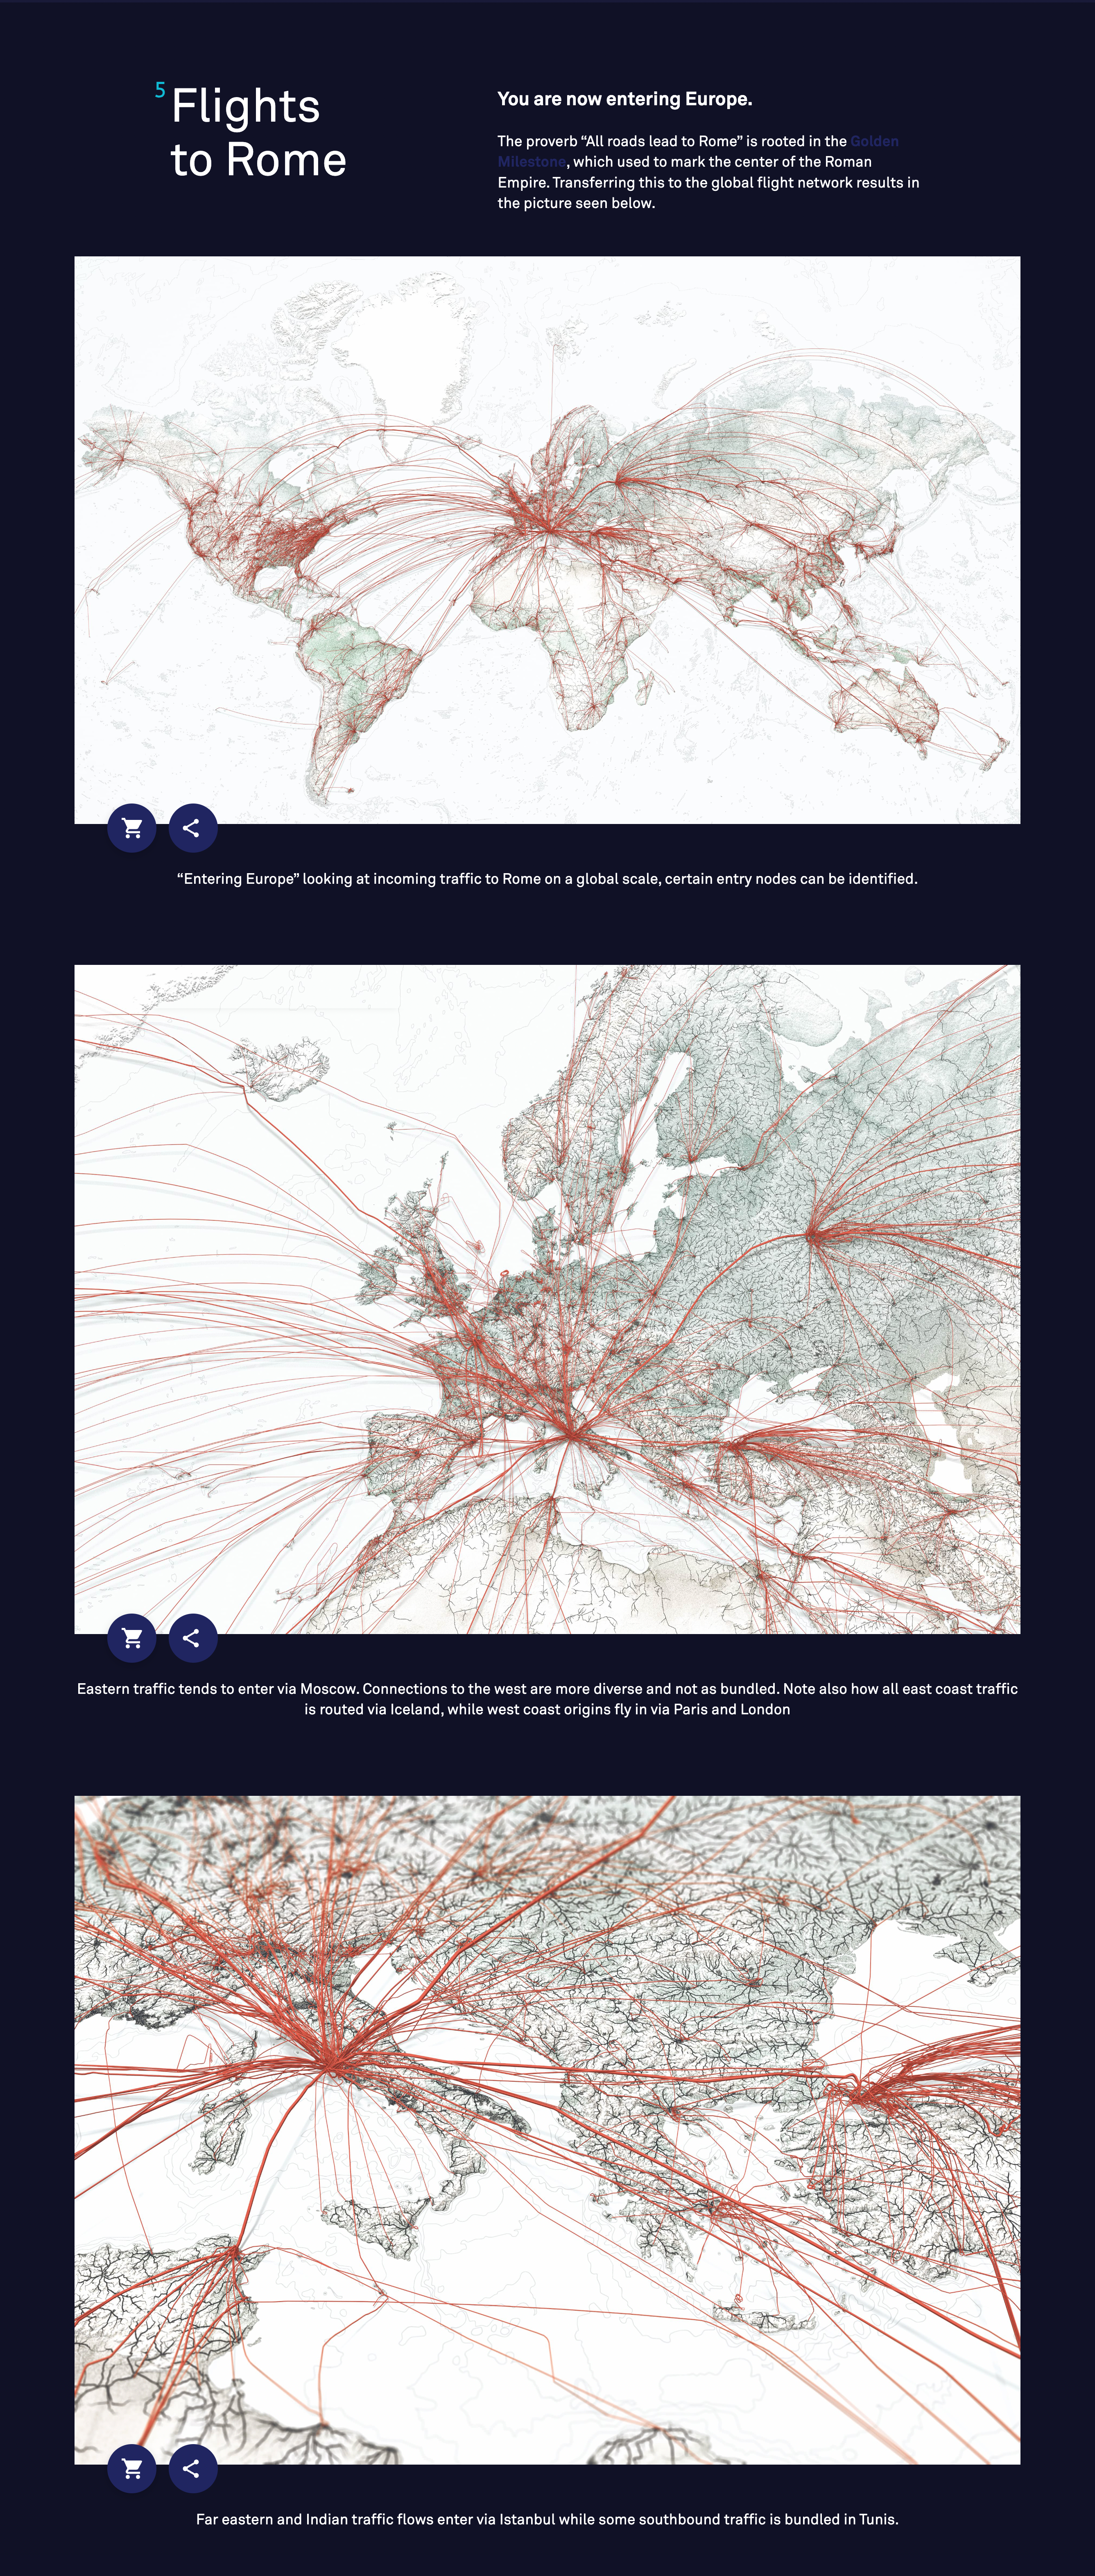
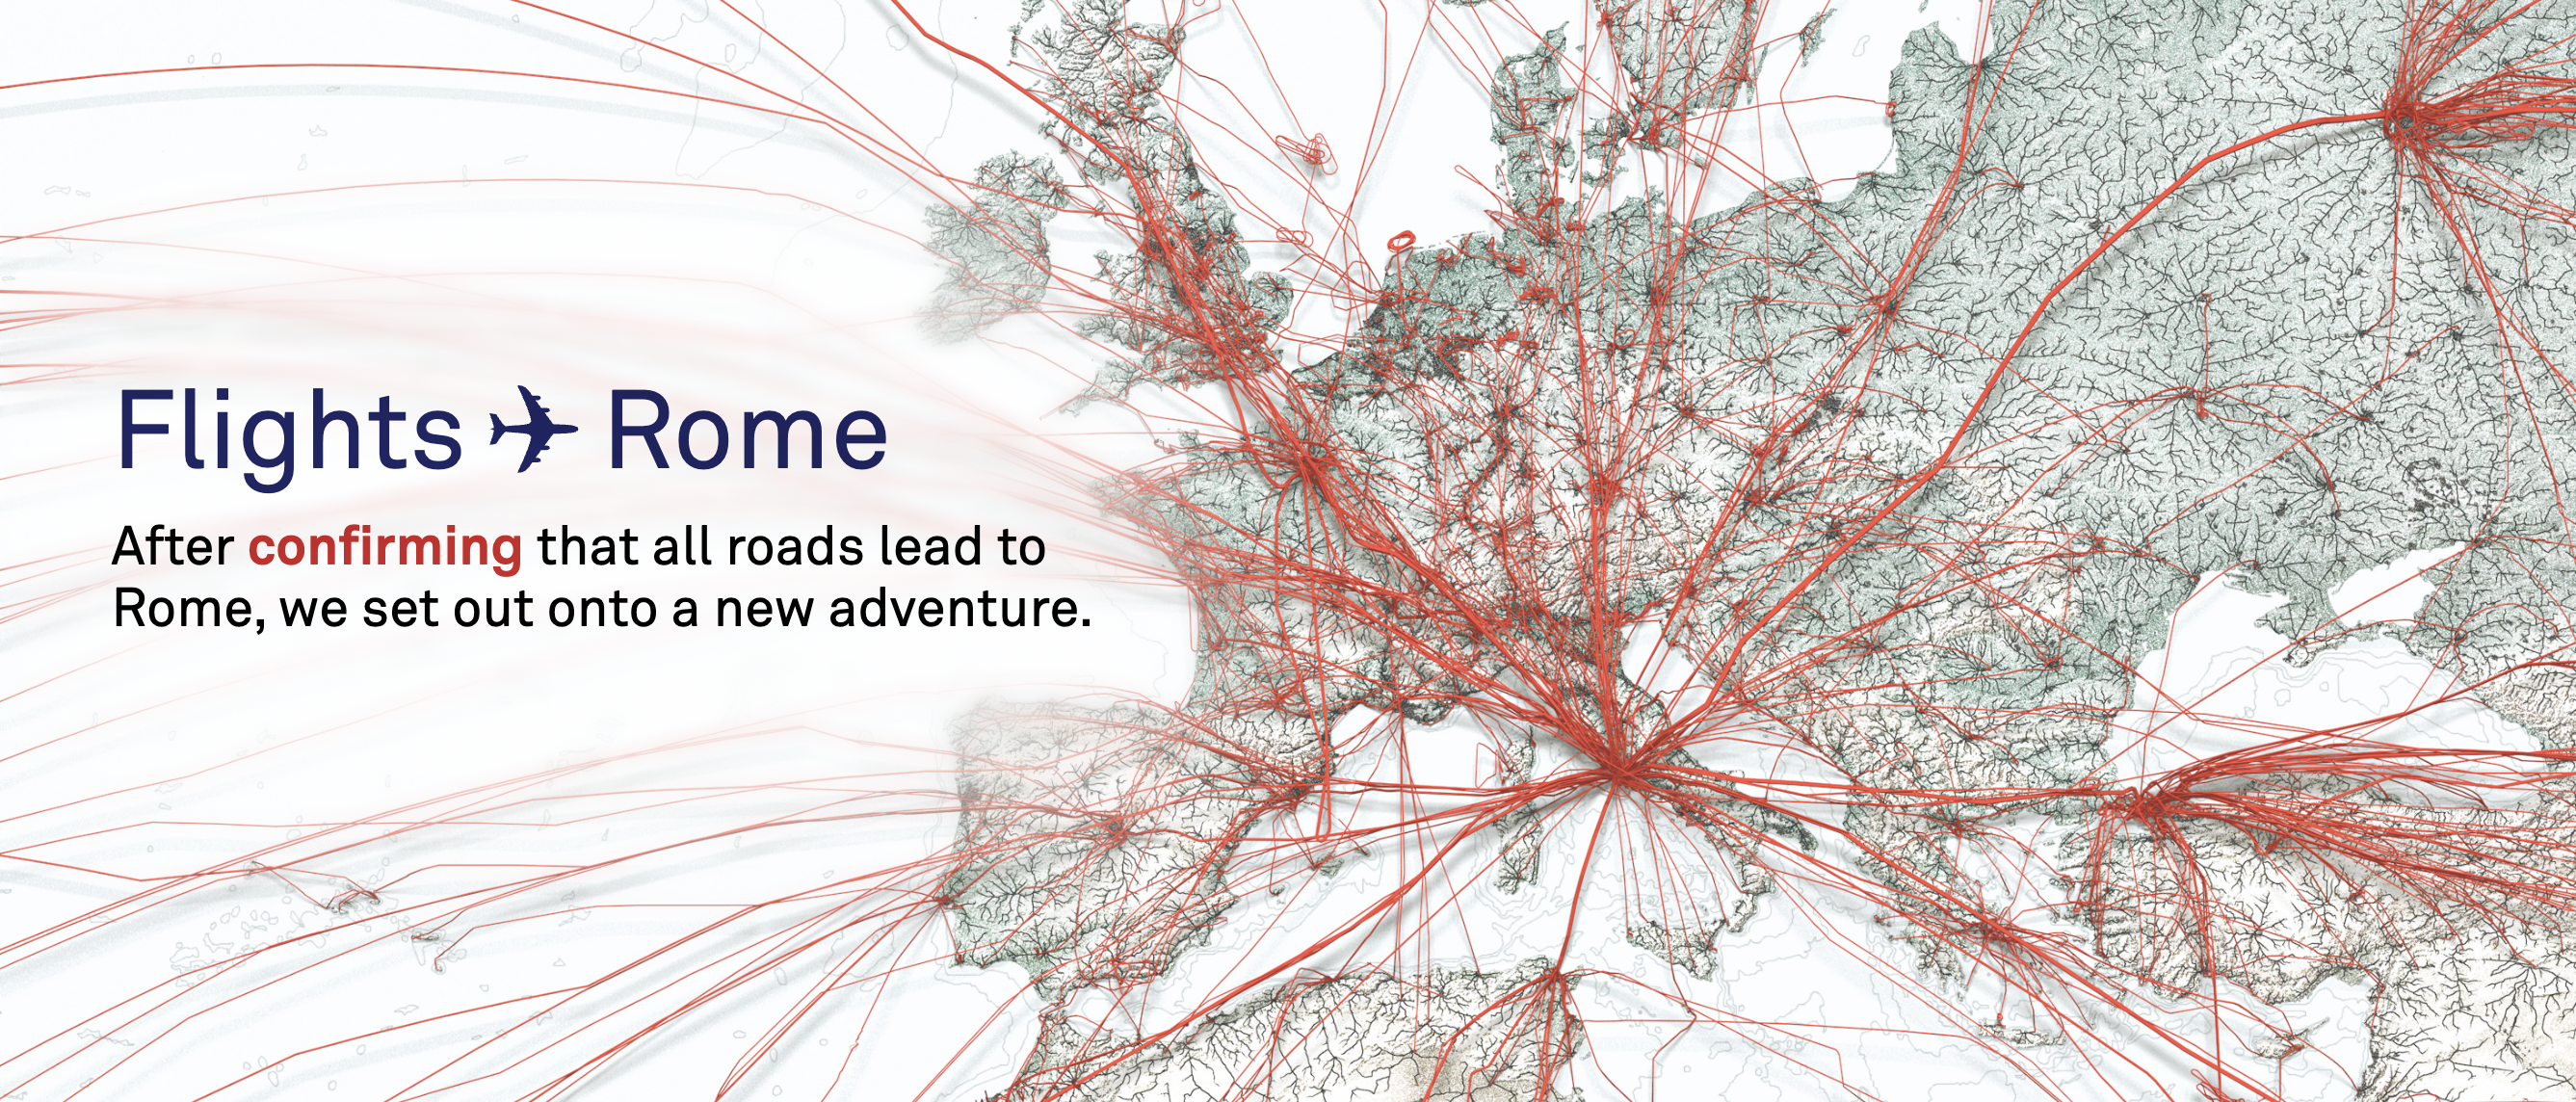
Key Visuals
The final images that were rendered by Herwig Scherabon↗ based on my generated data.
But this is how it started (in QGIS↗):
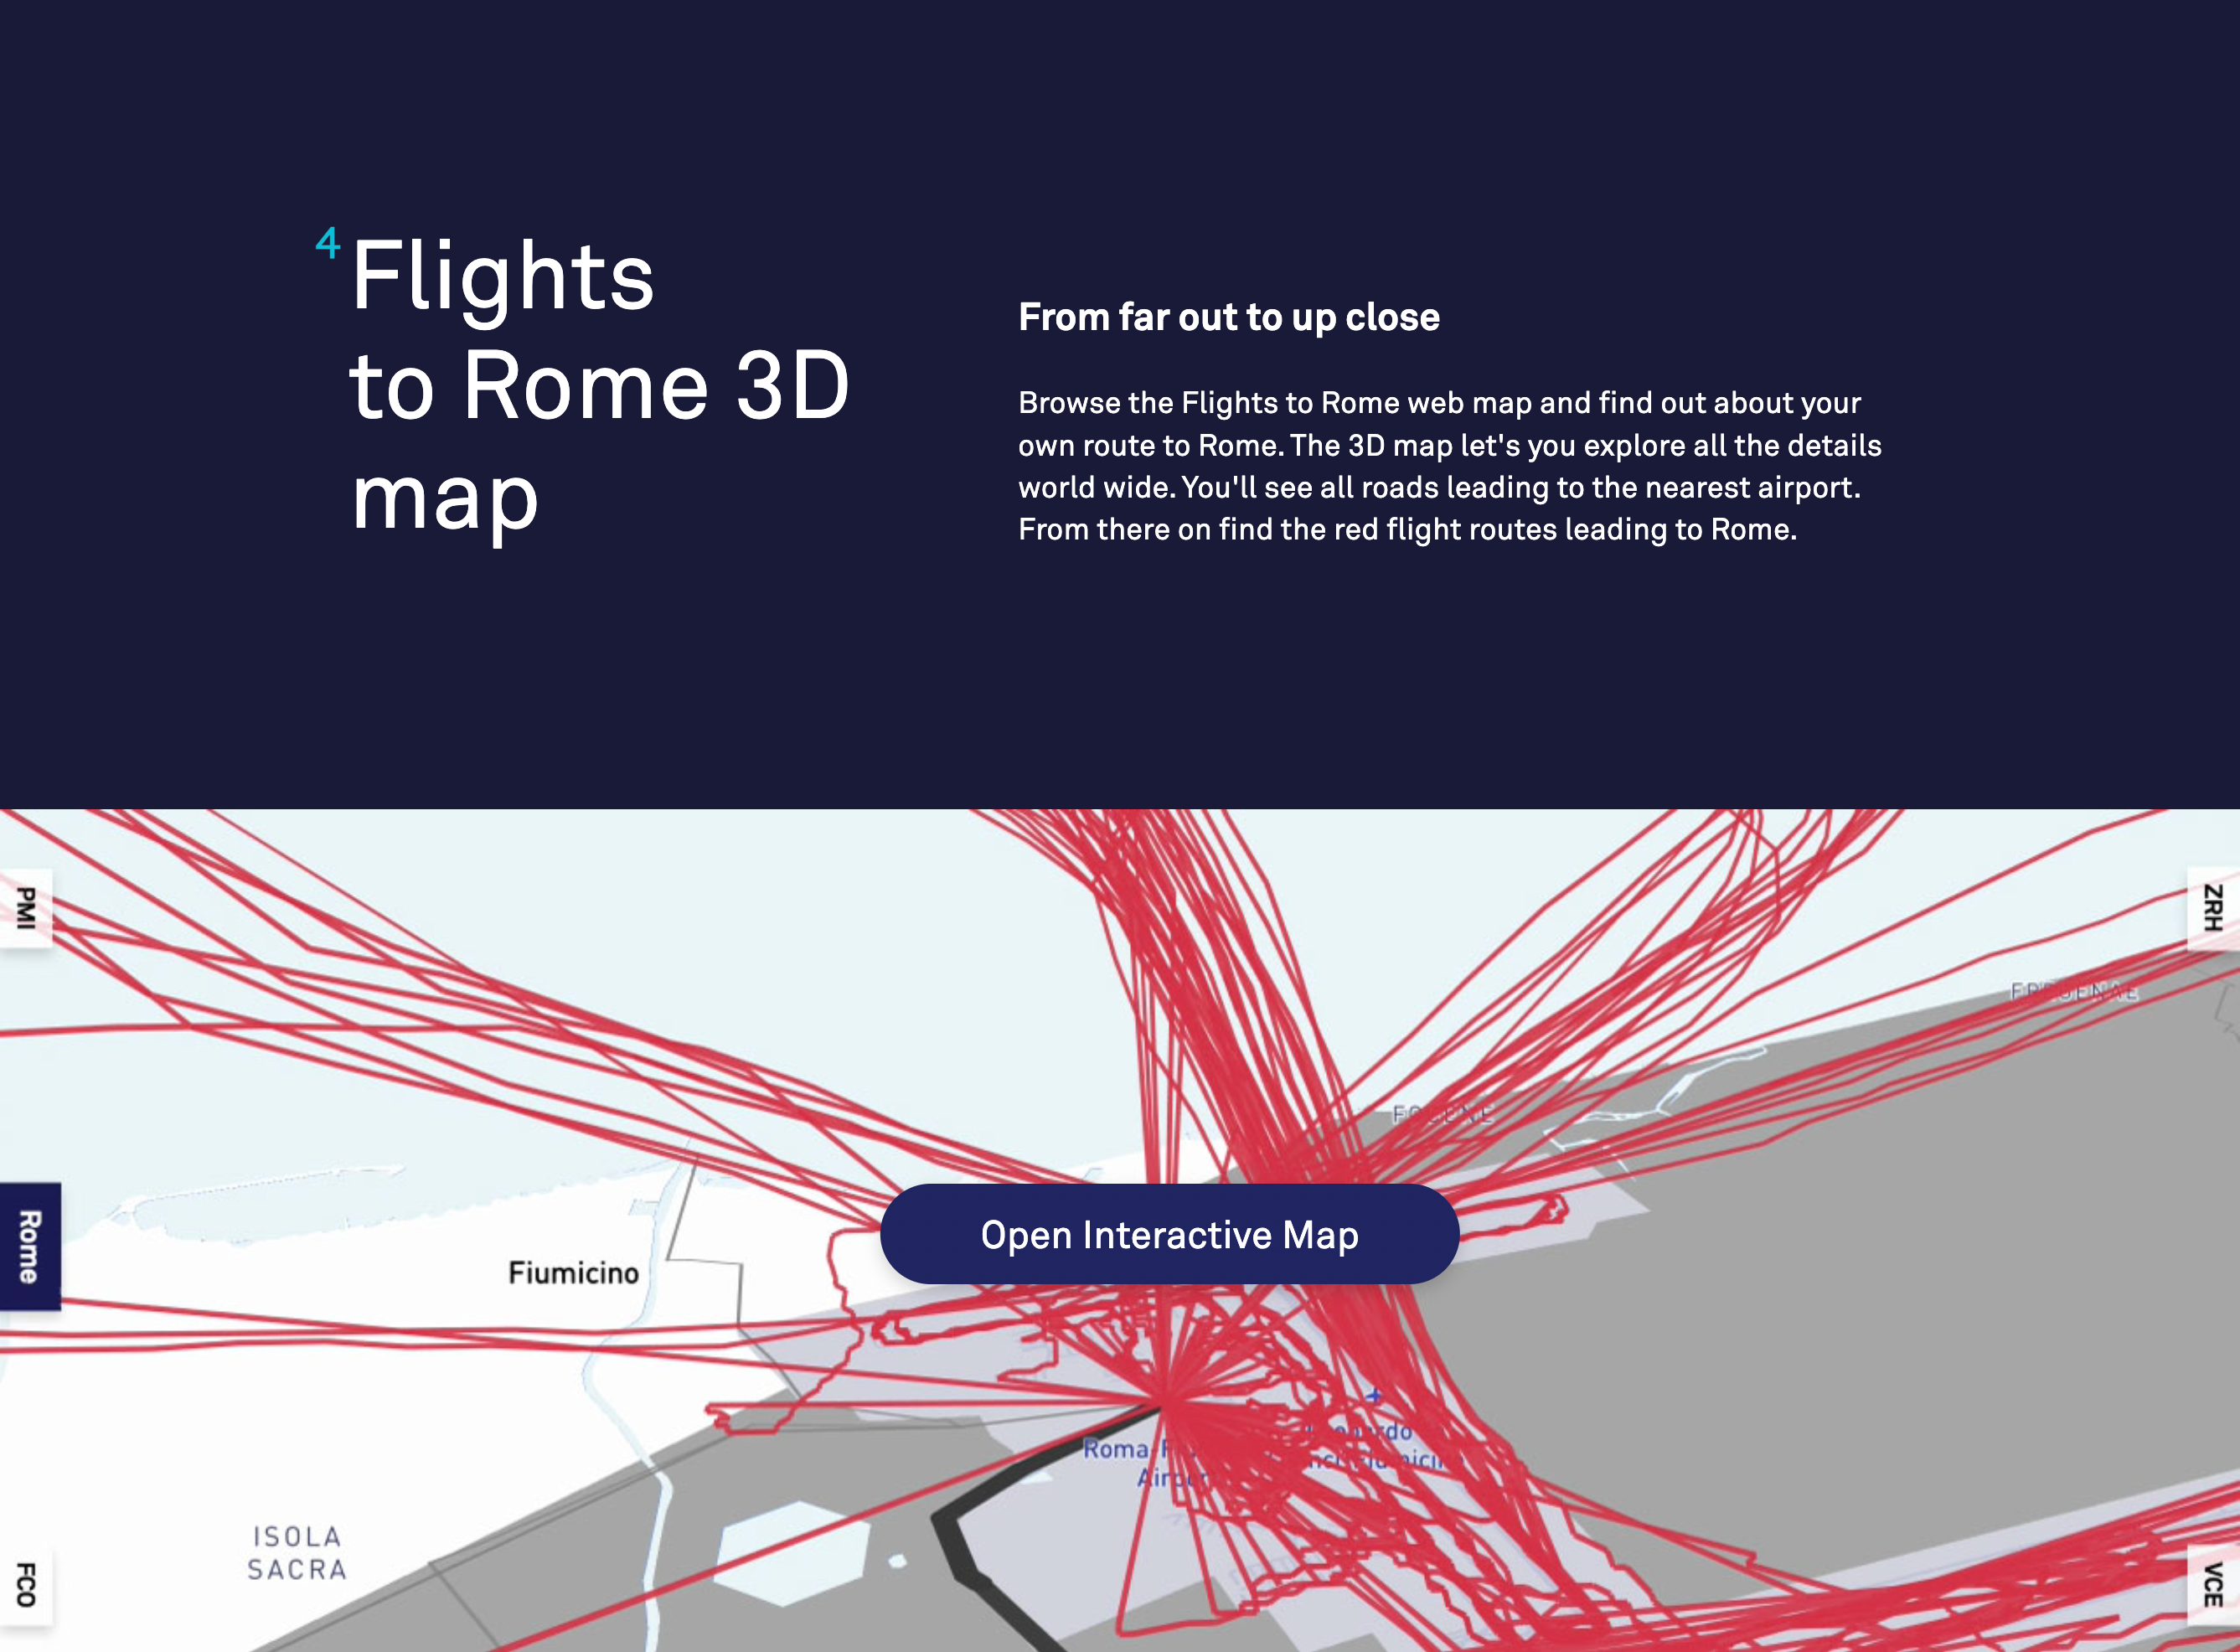
Interactive map
Thanks to Thibault Durand↗ (our web developer) we even had an interactive version of the map.
There you could see exactly how planes leave the airport thanks to GPS and altitude data.
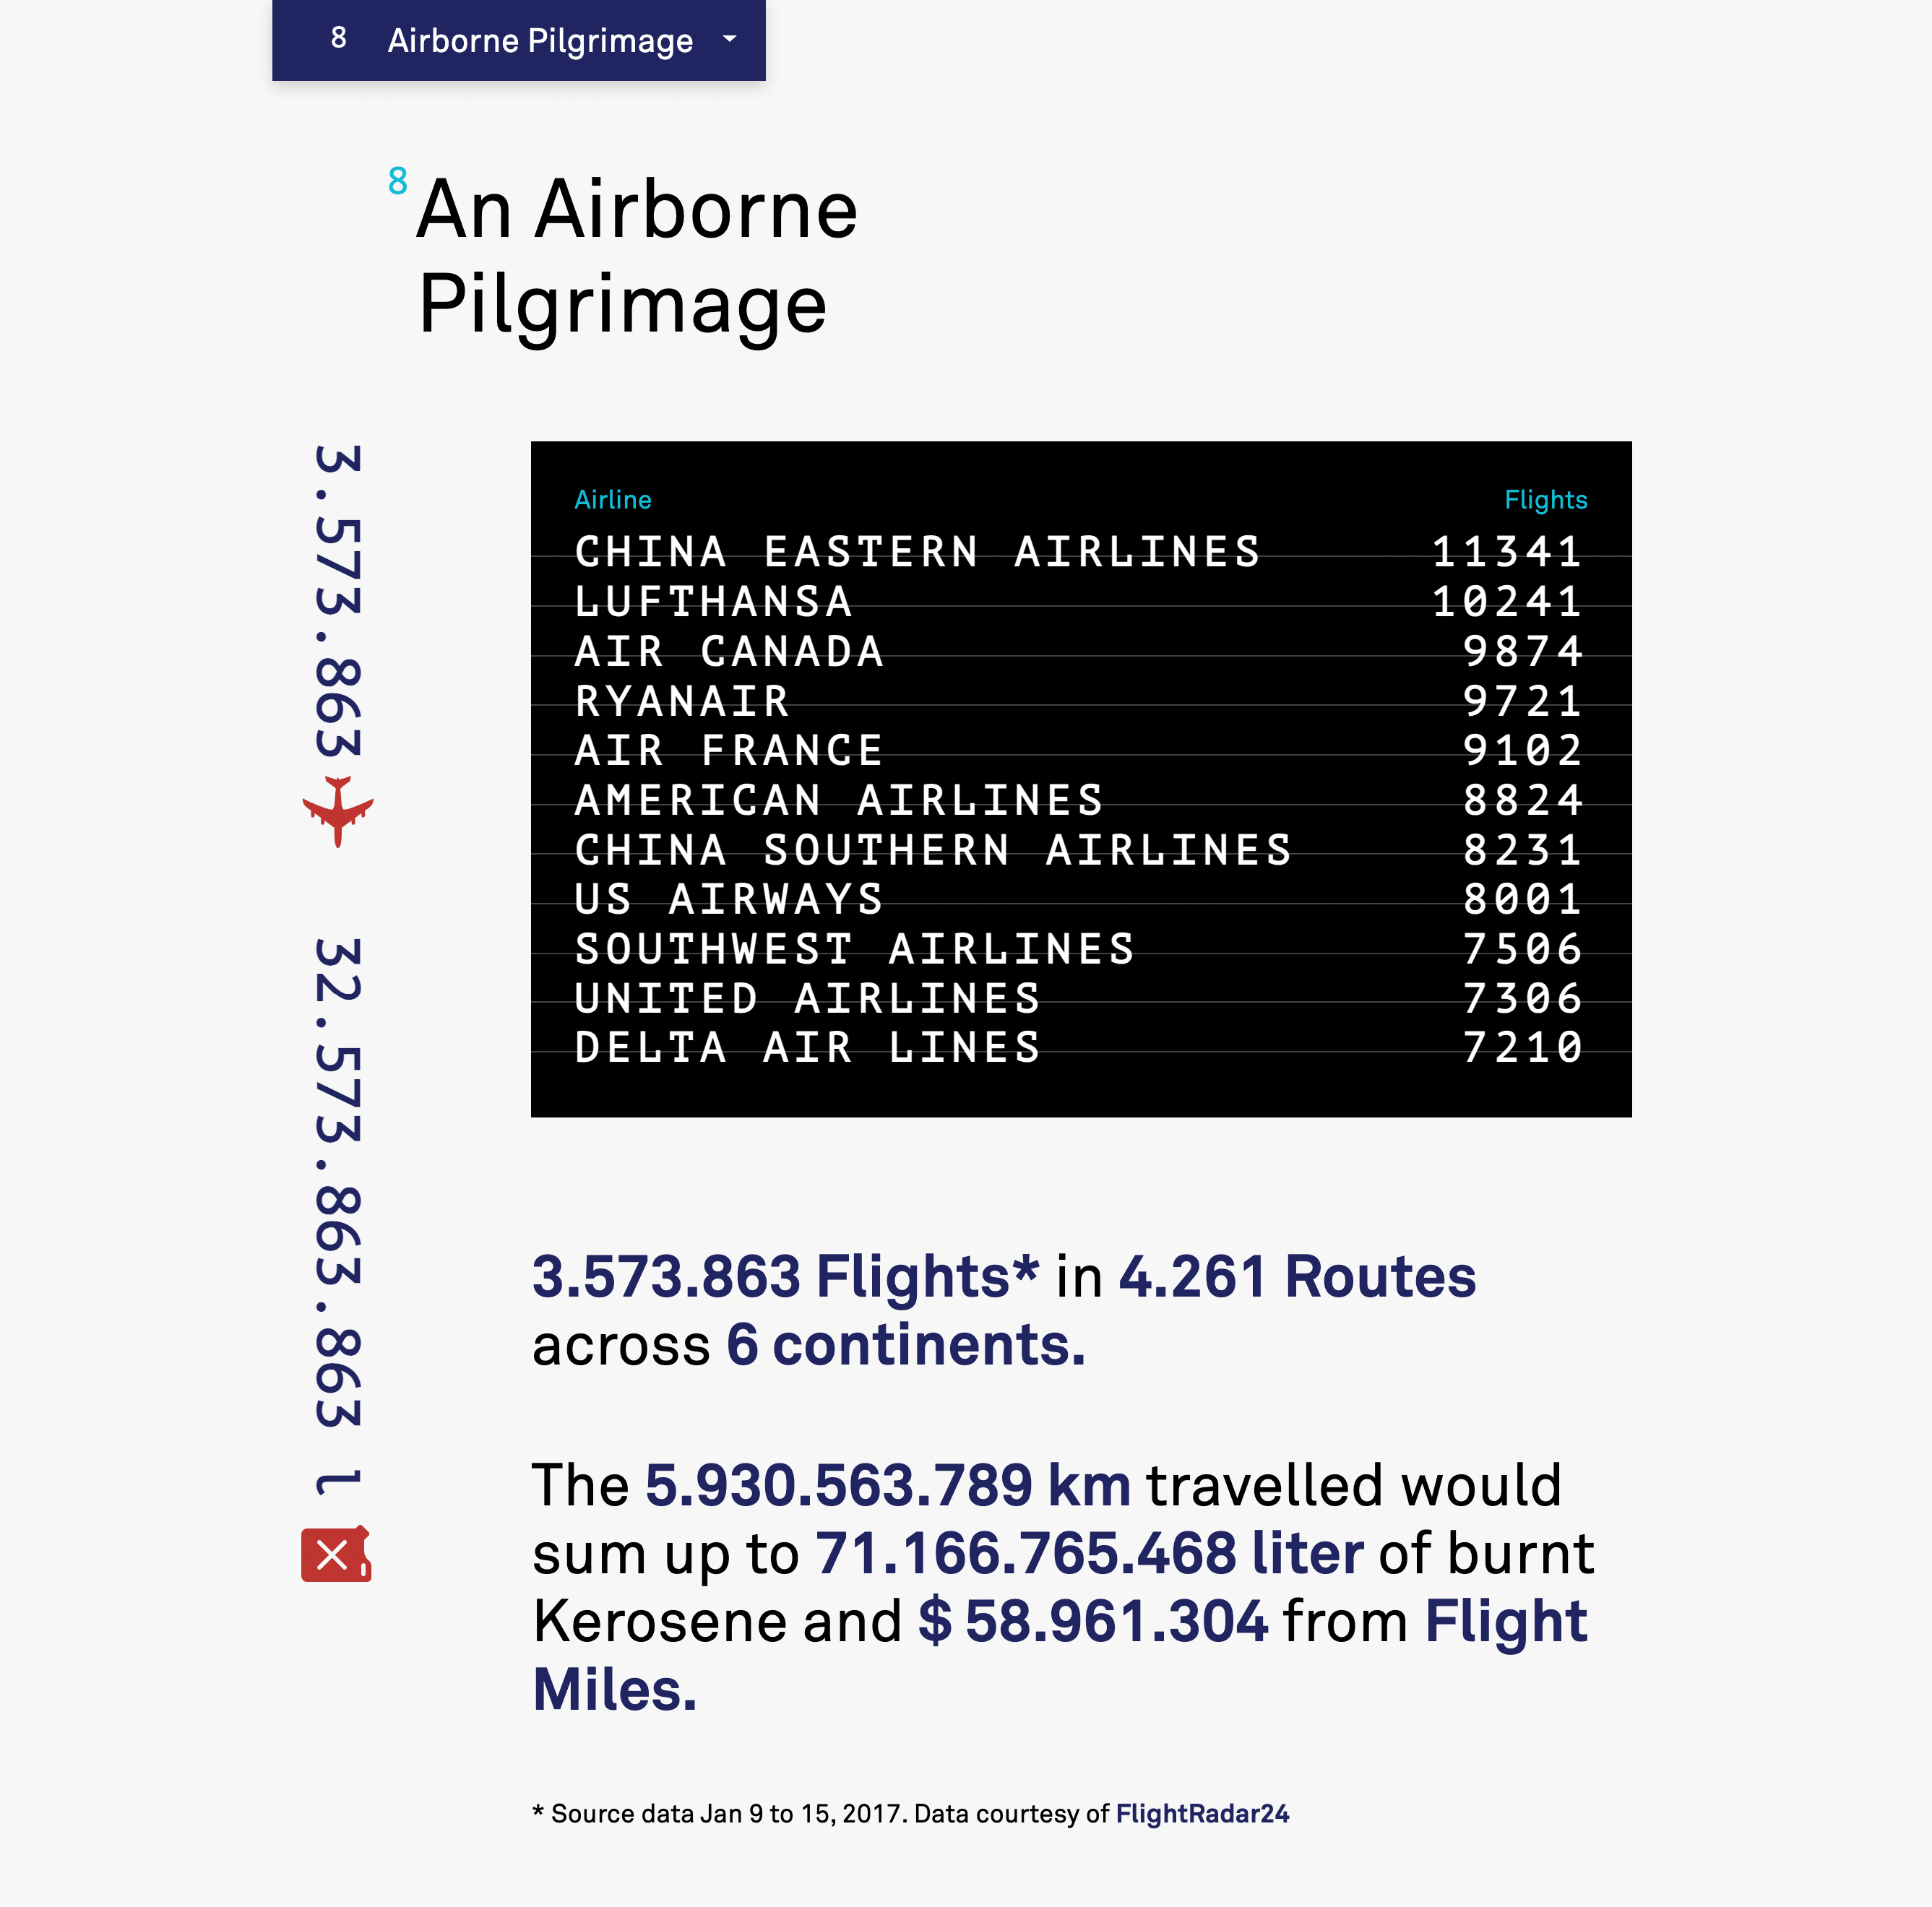
Understanding data
When we think about visualizing data, it's often about shiny graphics. But sometimes text or tables can be equally insightful.
Here we counted the flights per airline and converted the data into into the amount of Kerosene burnt and frequent flyer miles collected.
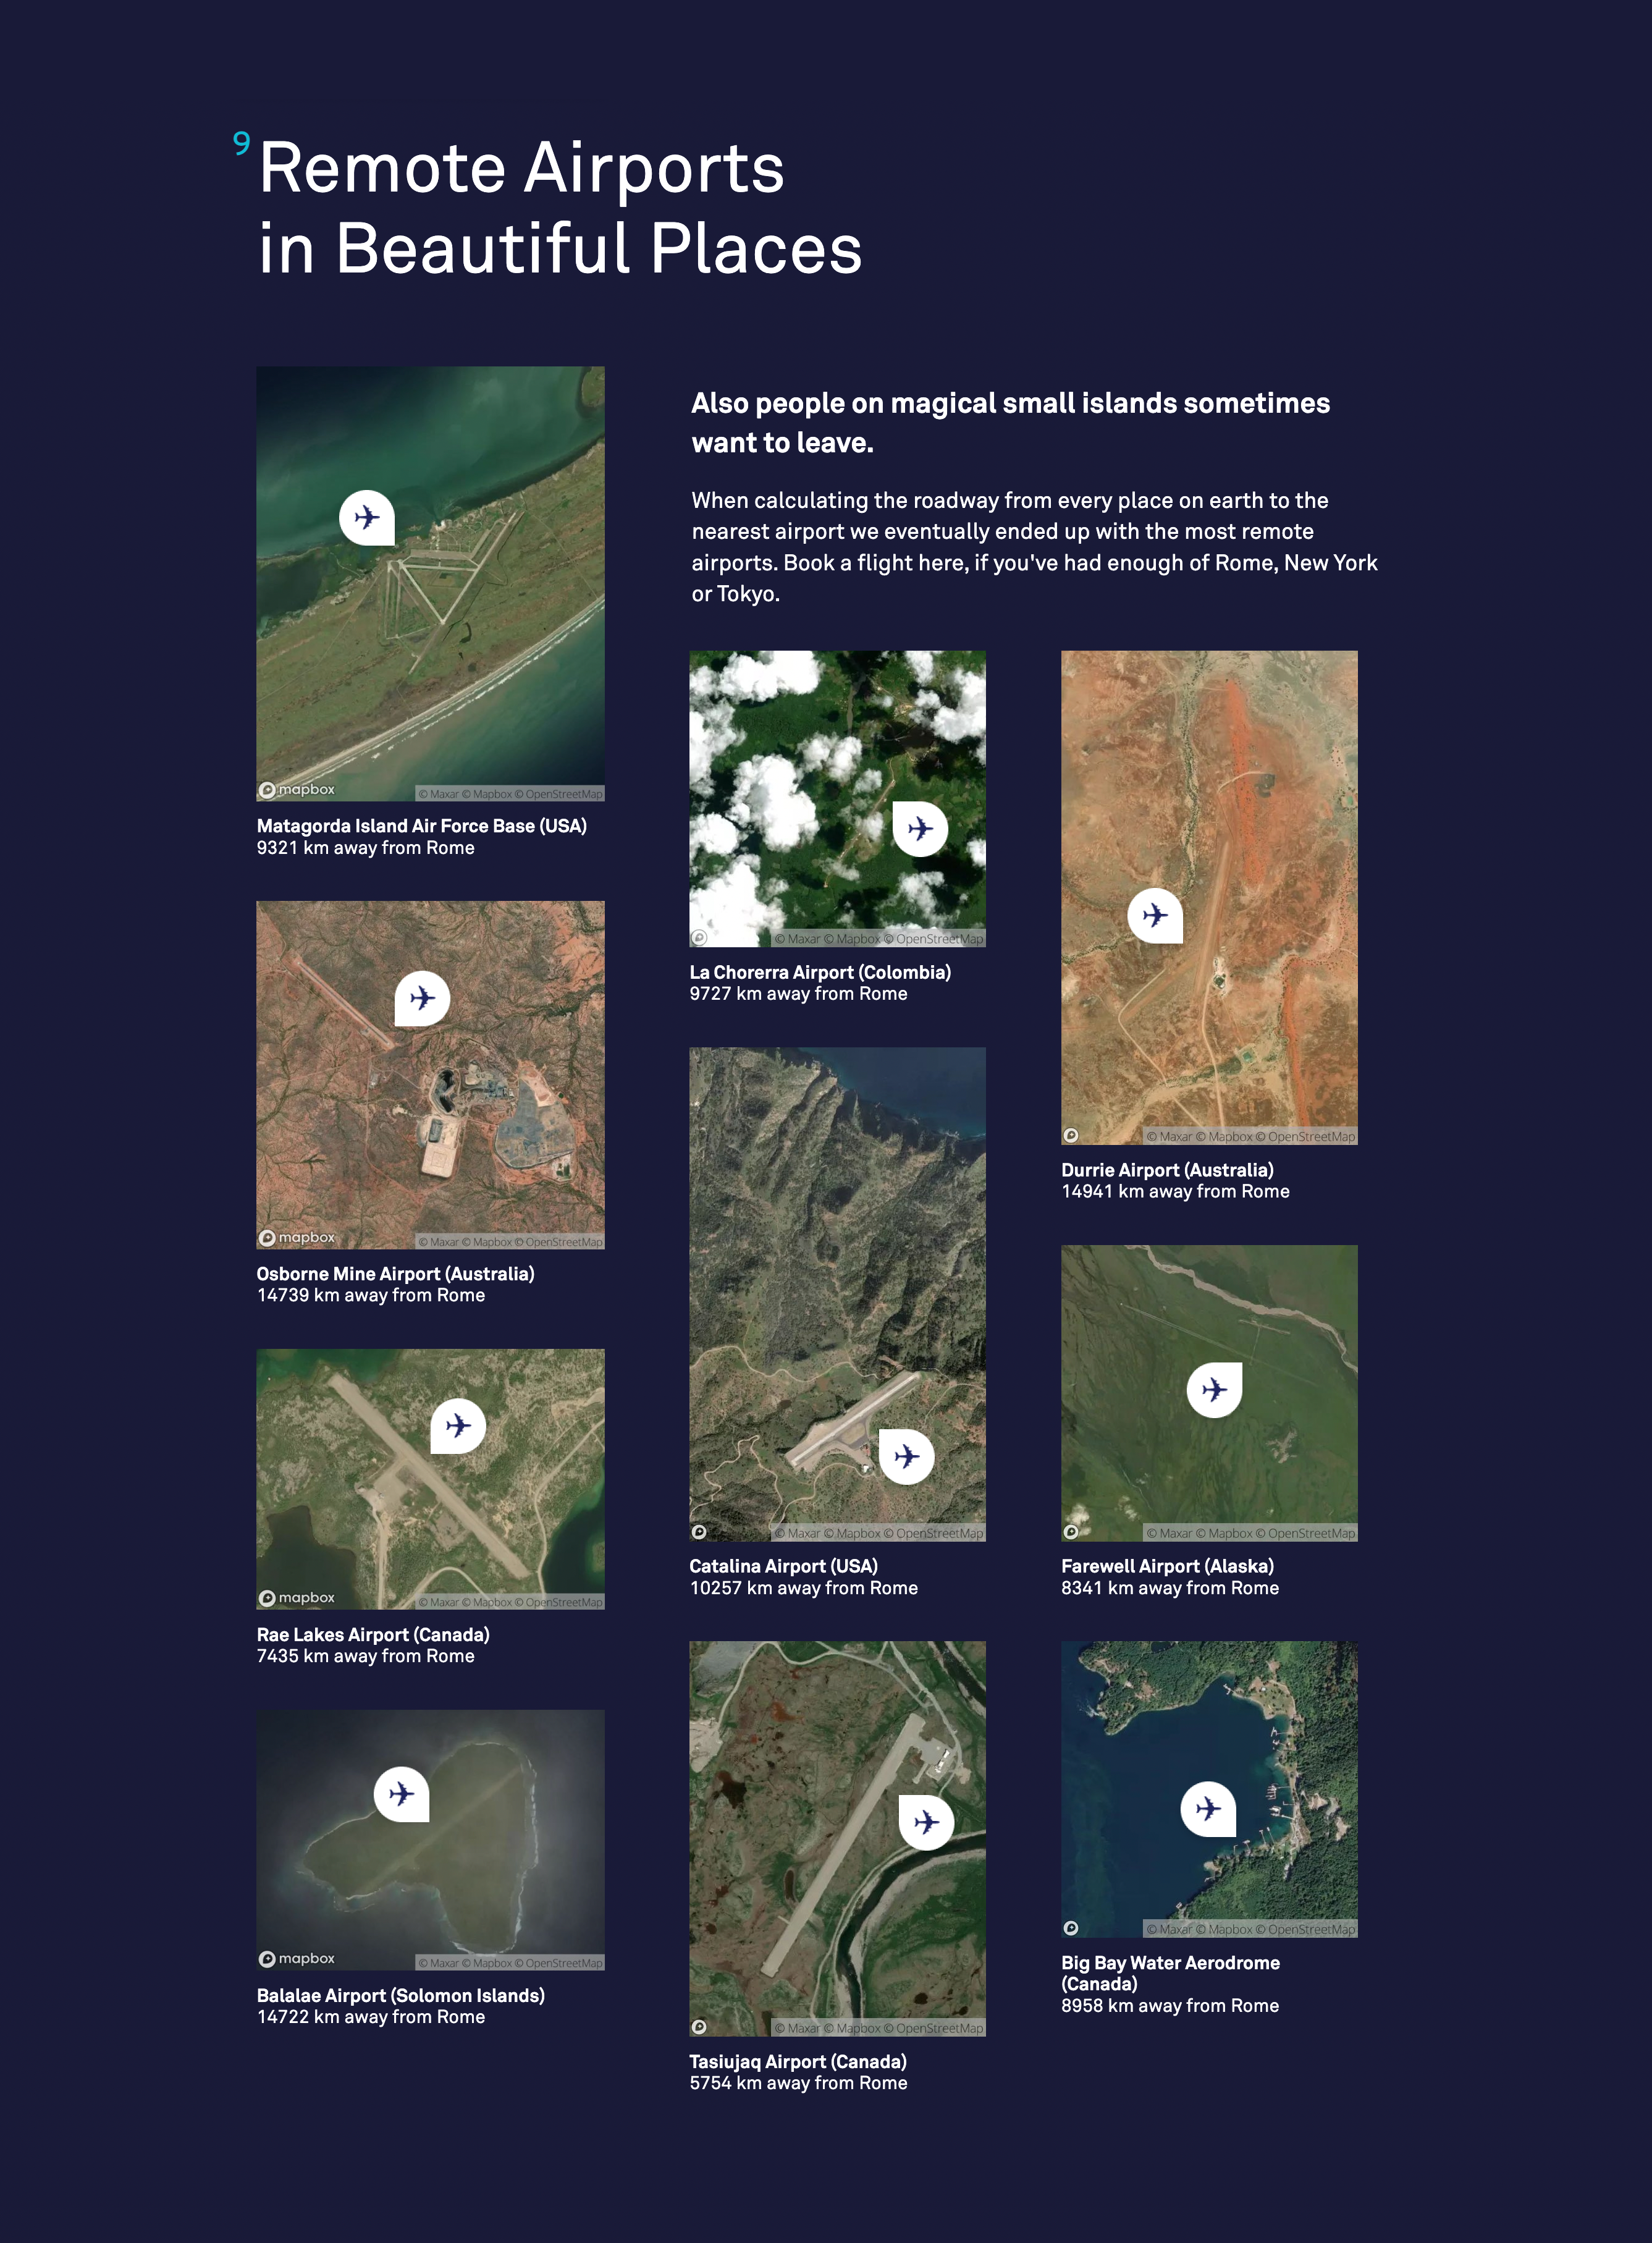
Oddly remote
When cleaning data or checking for errors, I discovered many airports in beautiful and oddly remote places.
We wanted to preserve them, so we gave them their own section.
Company blog post
If the above is not enough detail: We wrote an excessive blog post about all challenges encountered.
Read blog post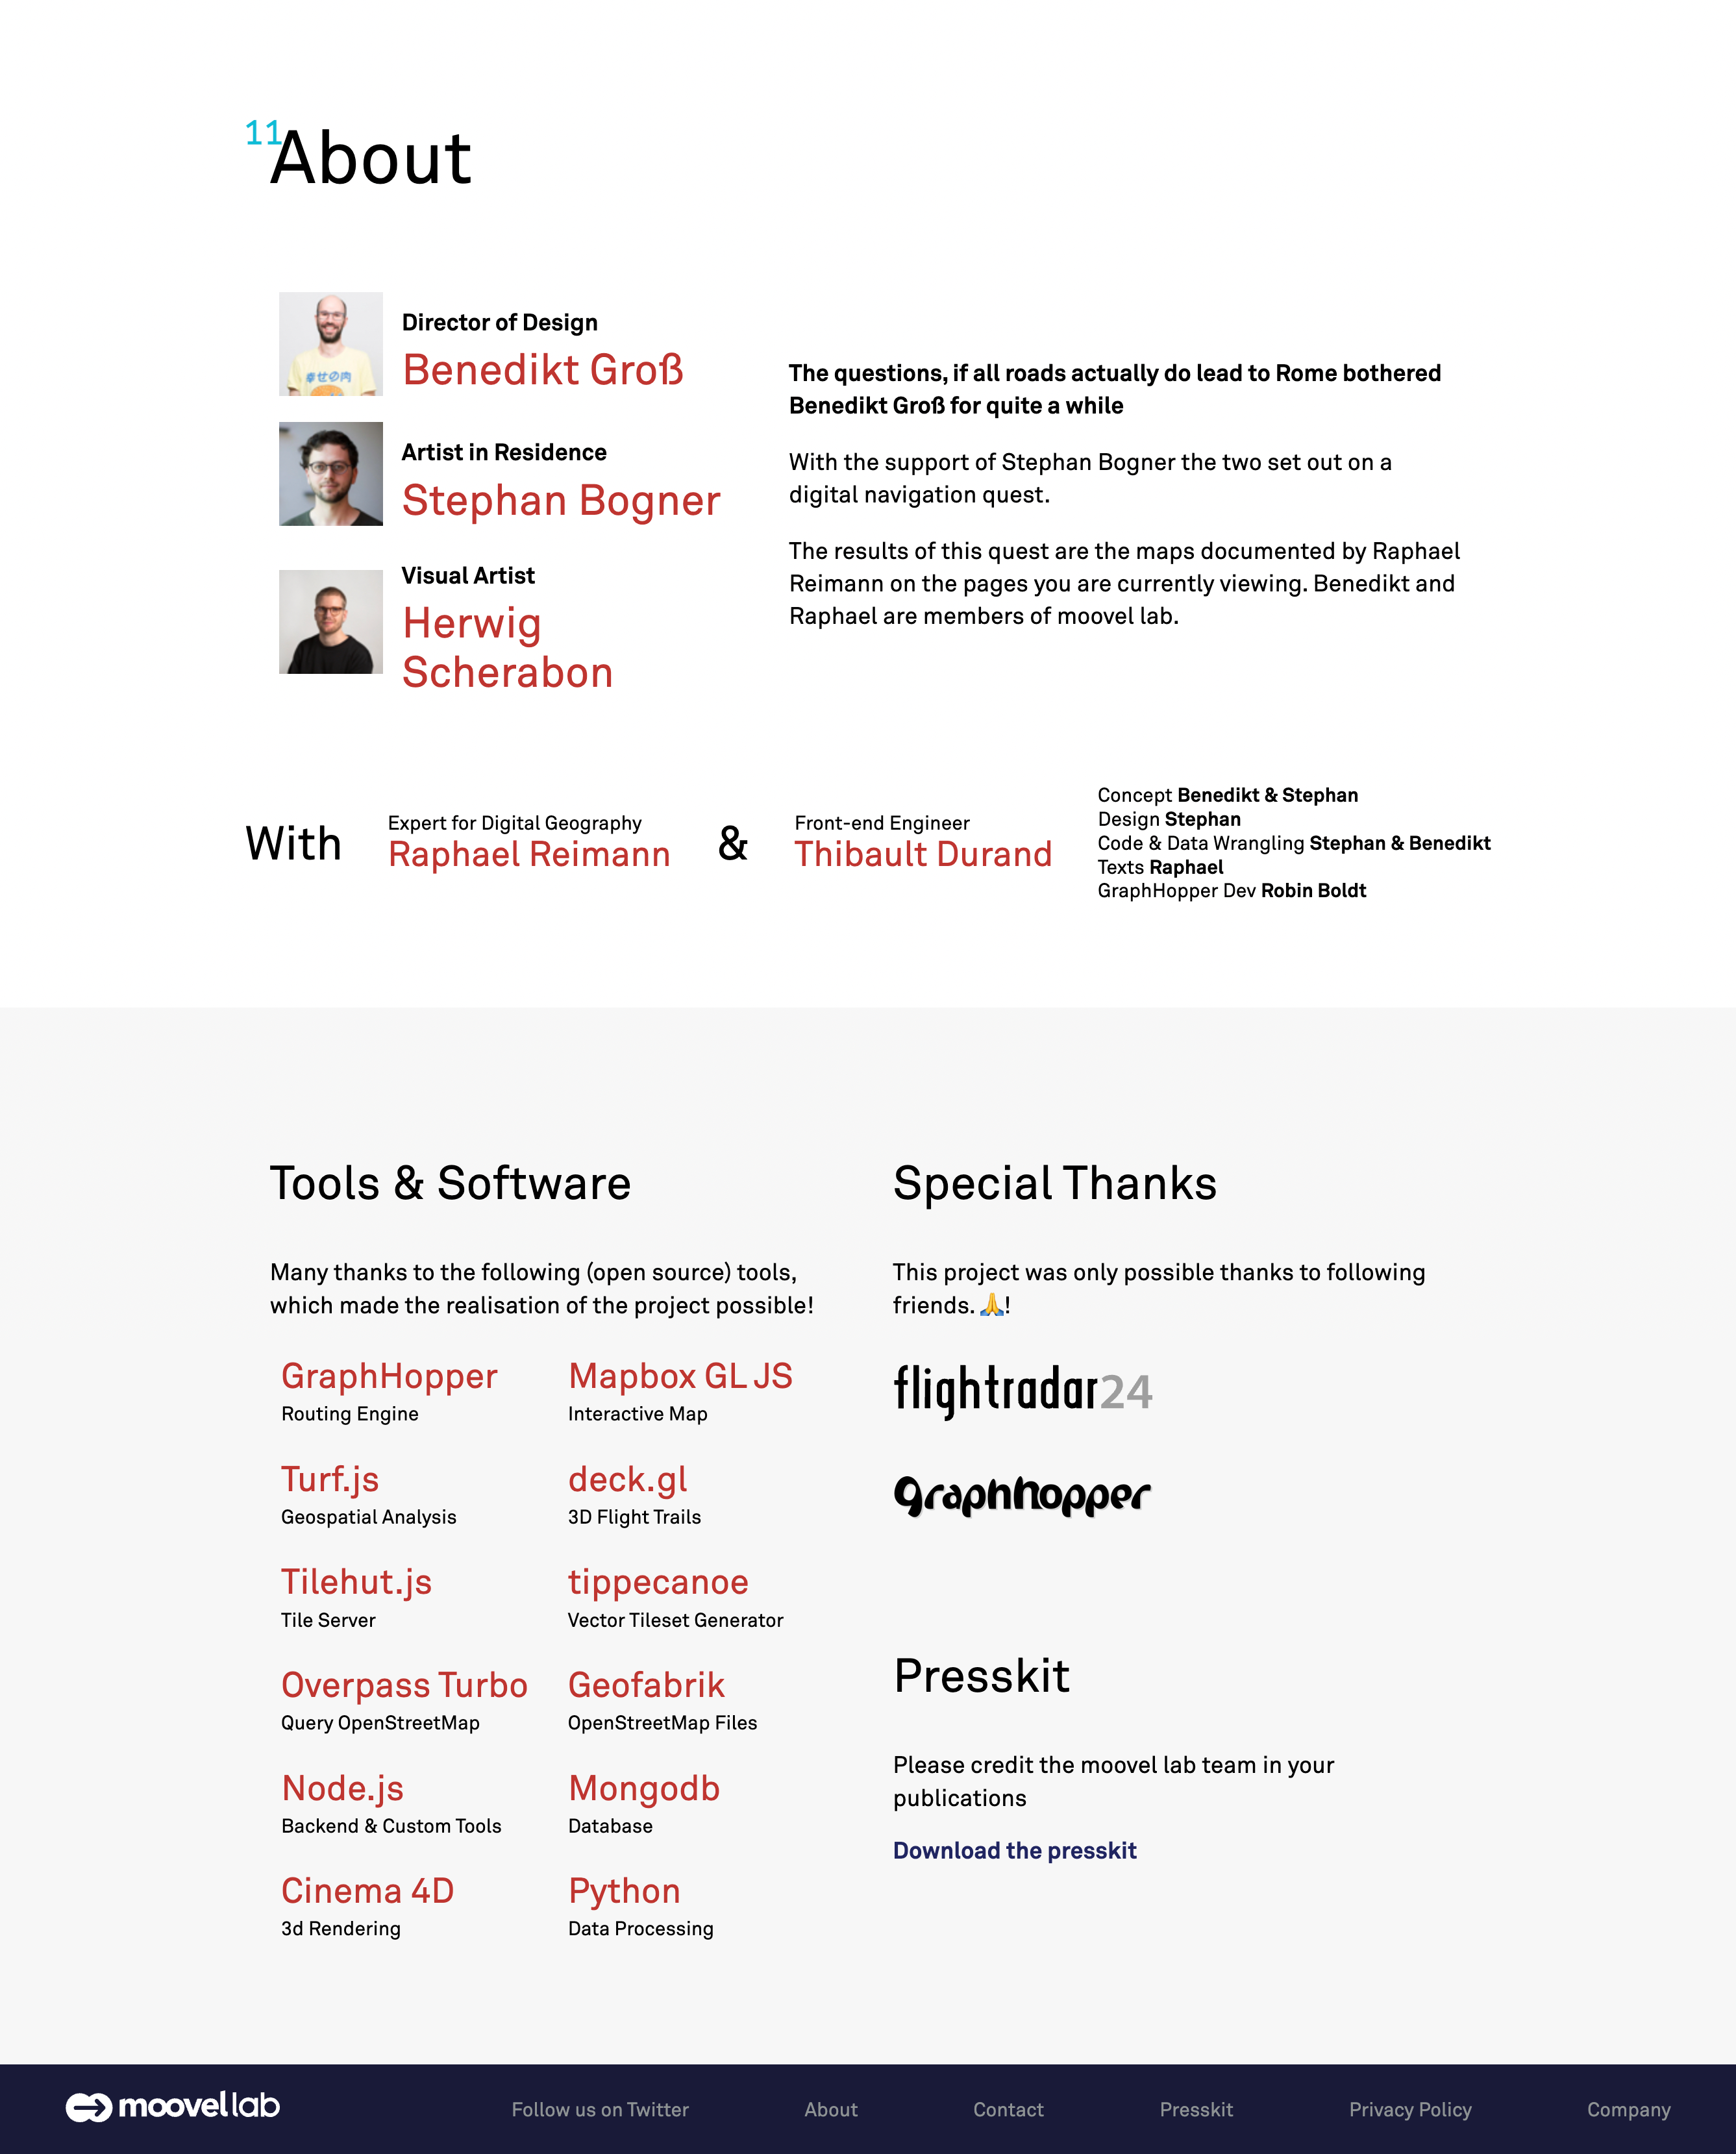
Credits
Many thanks to Benedikt Groß↗ for being the project's lead and making everything possible.
And also to Raphael Reimann↗ for writing most of the texts and helping in many other instances.