Copied to clipboard Copied to clipboard
 2018
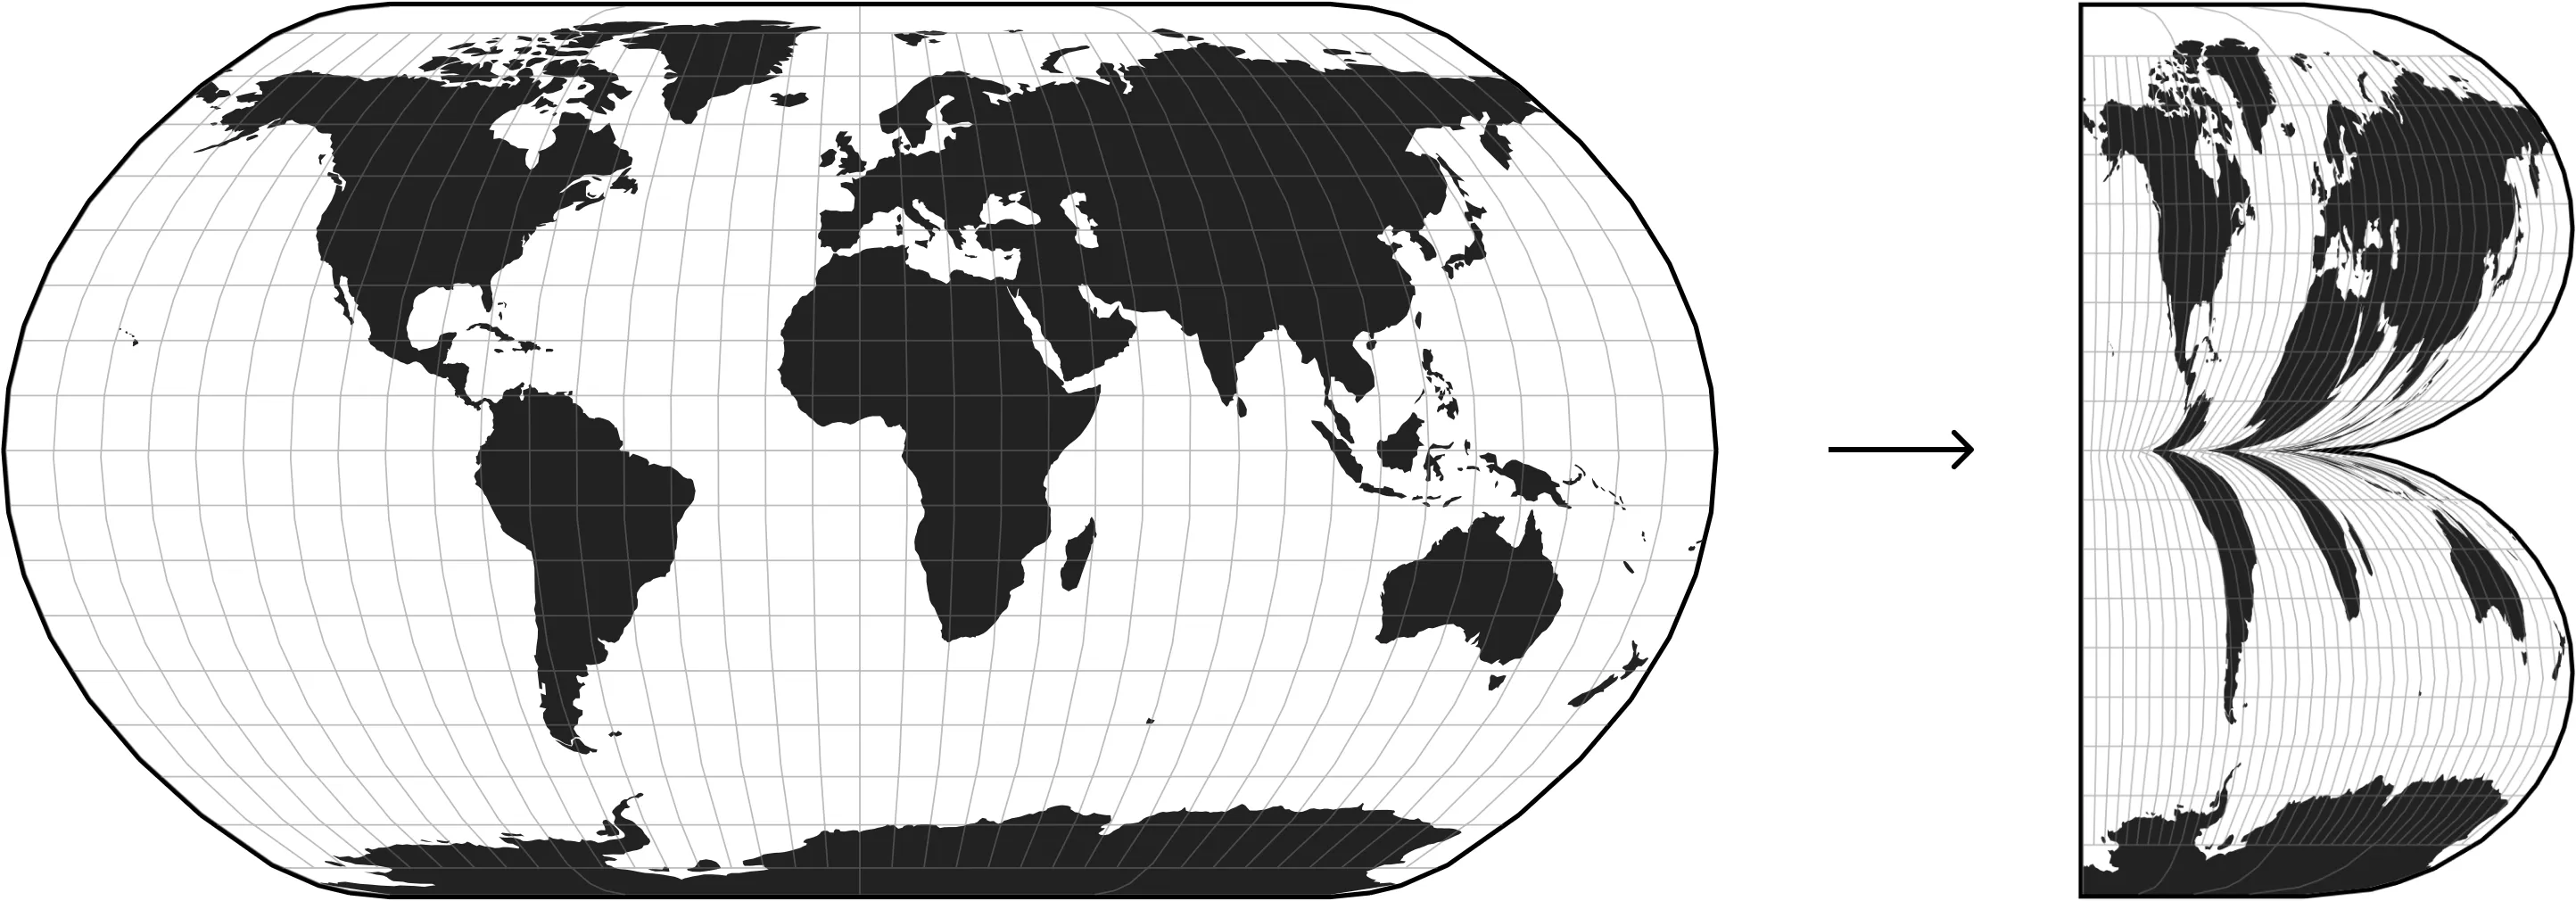
Map projections are essentially math formulas that convert polar coordinates (longitude & latitude) into “normal” cartesian coordinates (x & y).
Below you can find the code for my projection as well as Mercator↗, which is the one most maps use.
function mercatorProjection(lon, lat) {
	const x = lon
	const y = Math.log(Math.tan(Math.PI / 4 + lat / 2))
	return [x, y]
}

function bognerProjection(lon, lat) {
	lon = lon * 180 / Math.PI
	lat = lat * 180 / Math.PI
	const amplitude = Math.abs(lat/180) - 1
	const maxX = 0.5 + 0.6 * Math.abs(Math.sqrt(1 - amplitude*amplitude))
	const normalizedLon = ((lon / 180) + 1) / 2
	const y = lat / 90
	const x = -1 + normalizedLon * maxX
	return [x, y]
}Map projections shape our view of the world↗, but few people think or even know about them. I am surprised they didn't appear in George Orwell's 1984.
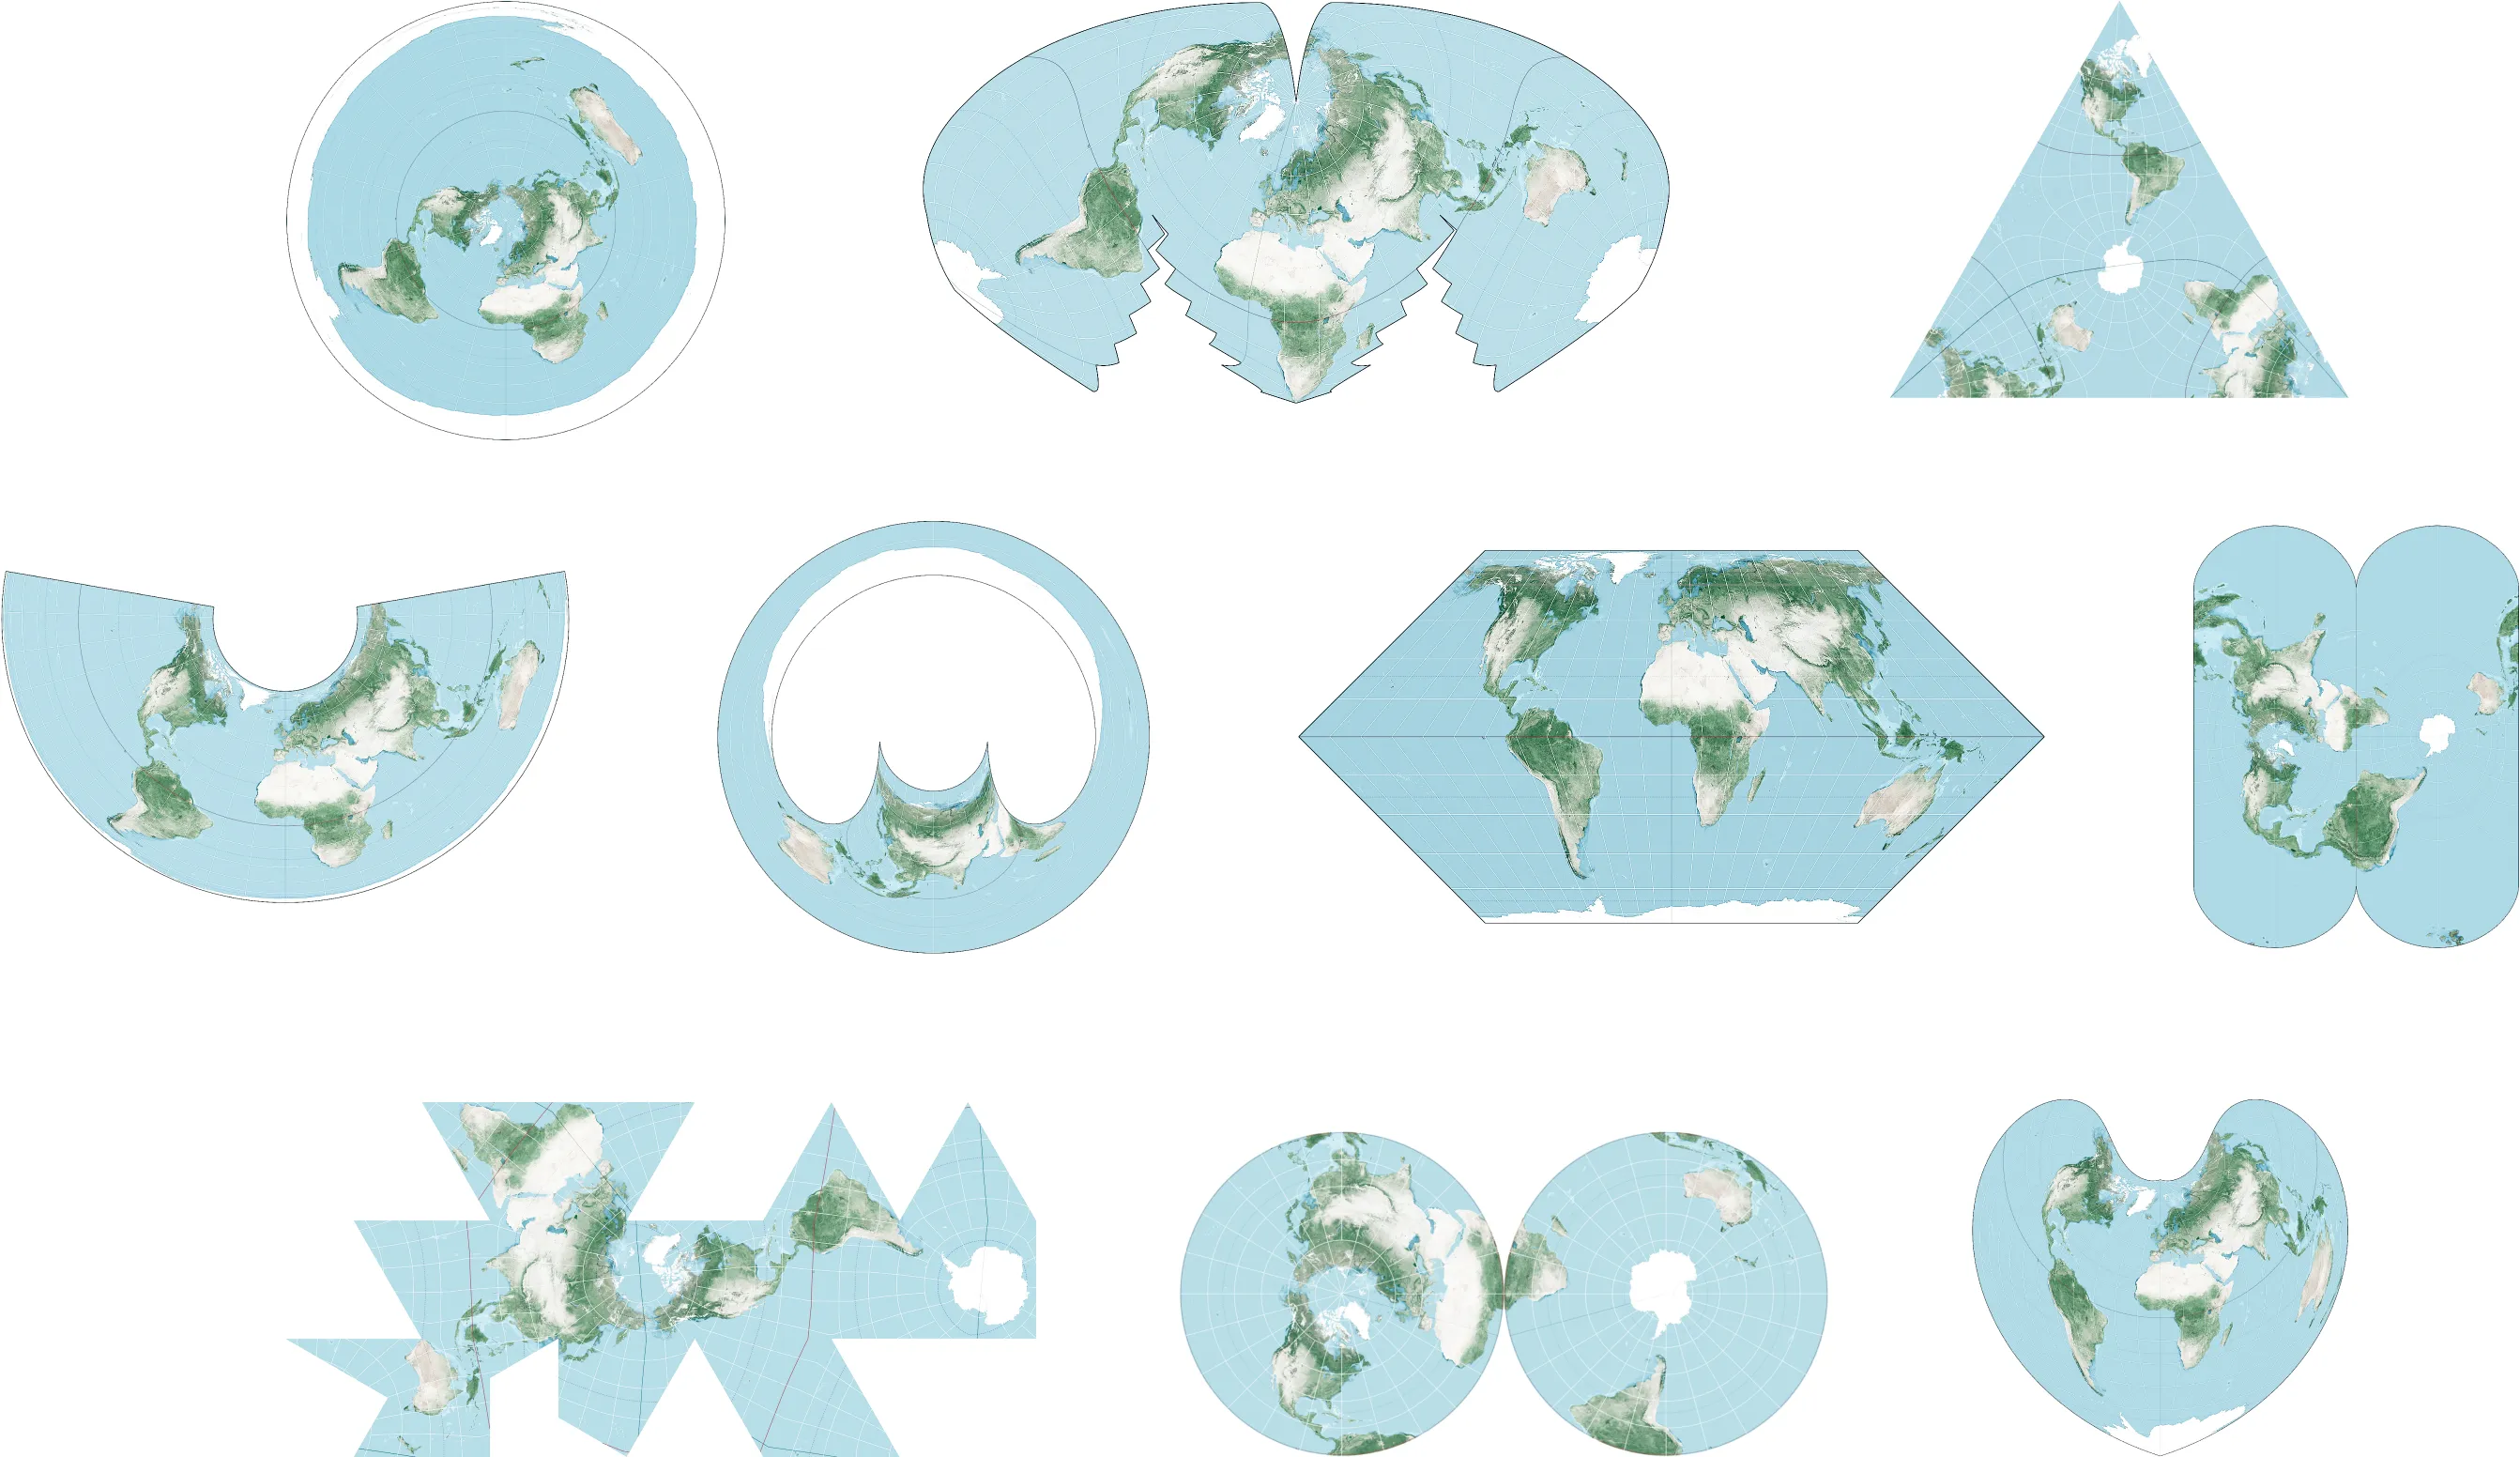
There is a saying that “All maps lie” because it's mathematically impossible to convert a sphere into a 2d picture without distorting parts of it.
The egocentric joke aside this was a great exercise to understand map projections on their lowest level.
I could also harness the power of d3.js↗ thanks to Mike Bostock's work↗.